
Fig. 4.
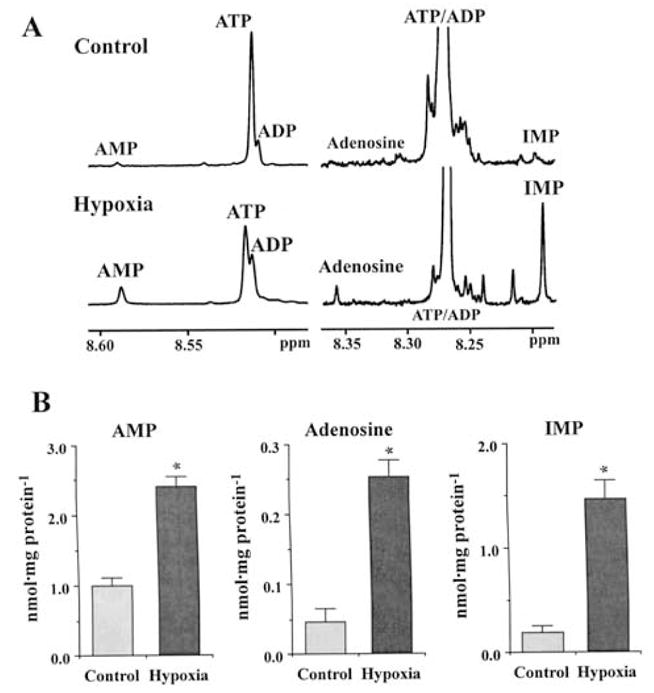
1H NMR-based analysis of metabolic signals following activation of adenylate kinase phosphotransfer in hypoxia. (A) Aromatic portions (ppm 8.62–8.45 and 8.37–8.18) of 1H NMR spectra with decrease of ATP and increase of ADP, AMP, adenosine and IMP in hypoxia. (B) Average metabolite levels determined from 1H NMR spectra. *Indicates statistically significant differences at p < 0.01.