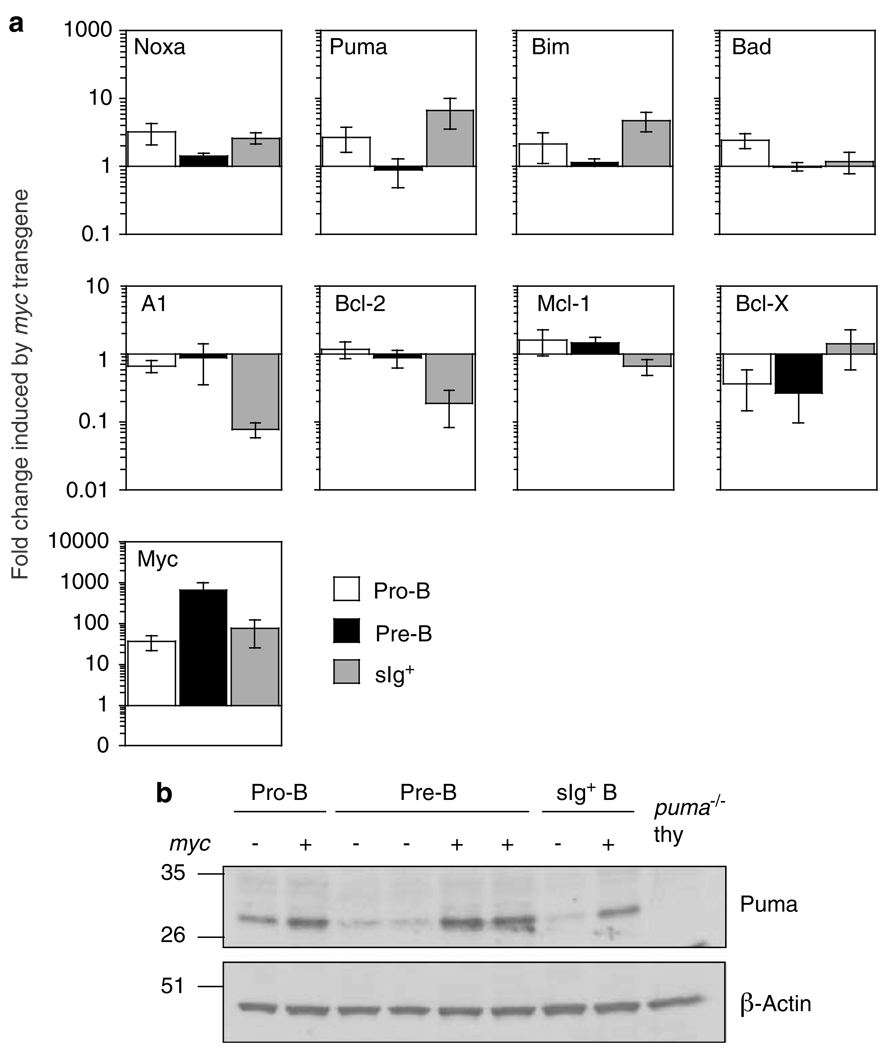
Figure 1. Puma and Noxa expression is increased in B cells from Eμ-myc mice.
(a) Differences in the levels of RNA for Bcl-2 family members and Myc between cells from Eμ-myc and non-transgenic mice. Pro-B, pre-B and B-cell subsets were FACS purified from healthy 5- to 6-week-old Eμ-myc or non-transgenic syngeneic (C57BL/6) mice. SYBR green real-time PCR analysis was performed on cDNA. Relative RNA expression levels were calculated by normalising to the signal for β-actin in each sample and then dividing the transgenic by the non-transgenic value. Mean expression is shown ± S.E.M. of cells from 3–4 individual mice of each genotype from at least three separate experiments. (b) Western blot analysis of Puma and β-actin (loading control) on protein isolated from the cell populations described in A. Puma-deficient thymocytes were included as a control for antibody specificity. Protein size standards in kDa are indicated on the left

