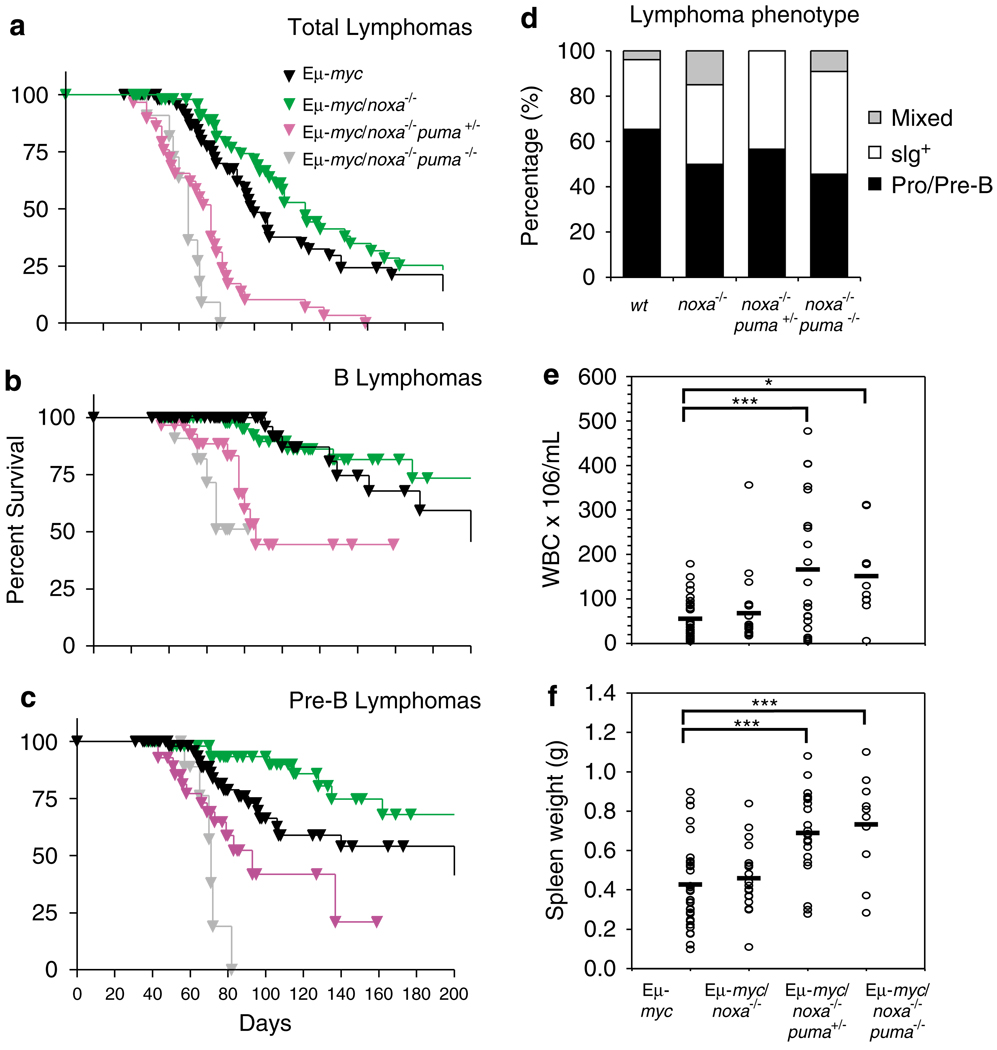
Figure 6. Loss of Noxa accelerates lymphoma development in Eμ-myc/puma+/− mice.
(a) Kaplan–Meier analysis of tumour-free survival of mice of the indicated genotypes. Lymphomas developed earlier in Eμ-myc/noxa−/−puma−/− (n=11) than Eμ-myc/noxa−/−puma+/− (n=29) mice (P<0.04) and both arose earlier than in Eμ-myc mice (n=64) (P<0.0001). (b) B lymphomas arose earlier in Eμ-myc/noxa−/−puma+/− than Eμ-myc/puma+/− mice (compare with Figure 4; P<0.01). (c) Pre-B lymphomas arose later in Eμ-myc/noxa−/− than Eμ-myc mice (P<0.05) but earlier in Eμ-myc/noxa−/−puma+/− than in Eμ-myc/puma+/− mice (P<0.01). Eμ-myc/noxa−/−puma−/− mice succumbed earlier than Eμ-myc/puma−/− mice (compare to Figure 4c; P<0.02). (d) The proportions of pre-B, sIg+ and mixed pre-B/B-cell lymphomas arising in Eμ-myc/puma+/− and Eμ-myc/puma−/− were not affected by additional loss of Noxa. (e) White blood cell numbers in sick Eμ-myc mice of the indicated noxa and puma genotypes. Each circle represents a single animal. Bars indicate means. Numbers of Eμ-myc, Eμ-myc/noxa−/−, Eμ-myc/noxa−/−puma+/− mice and Eμ-myc/noxa−/−puma−/− mice were 33, 20, 23 and 10, respectively. (f) Spleen weights of sick mice of the indicated genotypes. Bars indicate means. Numbers of Eμ-myc, Eμ-myc/noxa−/−, Eμ-myc/noxa−/−puma+/− mice and Eμ-myc/noxa−/−puma−/− mice were 34, 21, 22 and 10, respectively. *P<0.05, ***P<0.005

