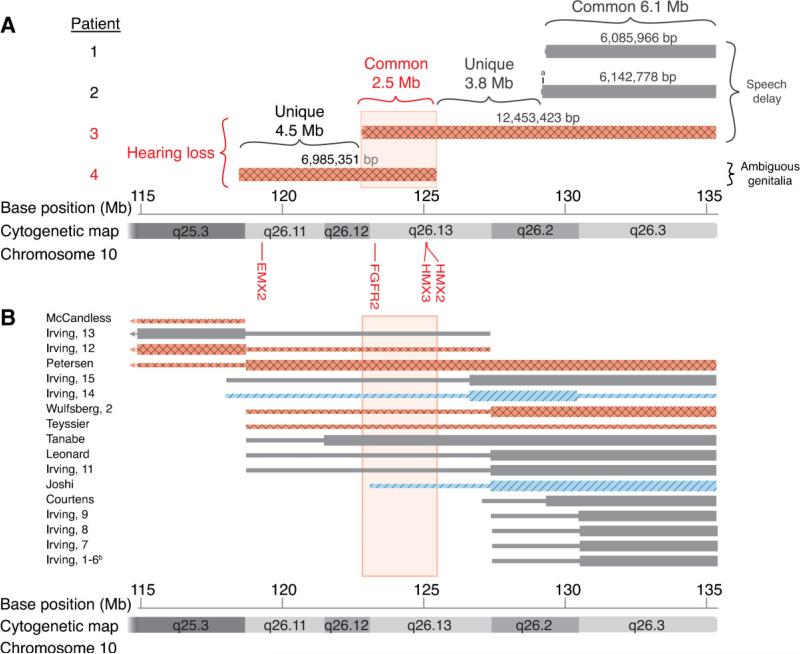
FIG. 3.
Overview of 10q deletion patients and hearing loss. Deletions of 10q for each patient are plotted. Thick bars indicate the minimum deletion. Thin bars indicate the maximum deletion. Diagonal lines (in two of the cases) indicate conductive hearing loss; diamond patterns (in six of the cases) indicate sensorineural hearing loss; and solid gray (in the remaining cases) indicates no hearing loss. A: Positions of the four deletions presented in this paper. B: Patients from the literature that have a pure 10q deletion and report on status of hearing loss. The row labels refer to the first author of the relevant publication and the patient number therein. aThe deletion in Patient 2 is 57 kb larger than in Patient 1. bIrving, Patients 1−6 are familial patients and thus depicted together [Teyssier et al., 1992; Petersen et al., 1998; Leonard et al., 1999; Tanabe et al., 1999]. [Color figure can be viewed in the online issue, which is available at www.interscience.wiley.com.]

