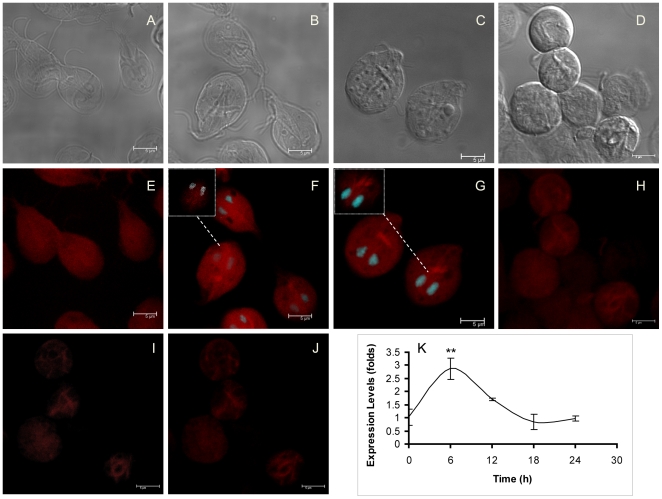
Figure 2. Distribution and expression of actin during encystation of Giardia lamblia.
Parasites cultured in encystation medium were stained with TRITC-phalloidin along the encystation process at time points 0 h (E), 12 h (F), 18 h (G) and 24 h (H). I and J, are optical slices of H. A–D, are the corresponding DIC images for E–H respectively. The insets in F and G are optical slices of the marked cells. The nuclei were labelled with DAPI. In the F inset, the white points represent the colocalization beetween DAPI and phalloidin. K, relative-quantitative RT-PCR analysis of actin expression at the same encystation times. Values are presented as fold change over time zero, **p = 0.0026.

