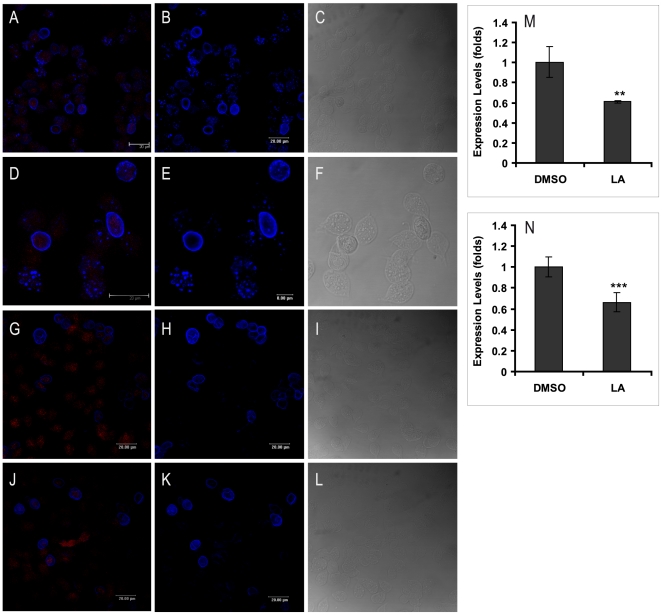
Figure 5. Effects of CD and LA on Giardia cysts.
The cells were treated with 10 µM CD (G–I) and 1 µM LA (J–L) for 24 h and stained with TRITC-phalloidin (red) and anti-CWP1 (blue). DMSO was used as a control (A–F). The superposition of actin and CWP1 images are A, D, G and J. M and N, relative-quantitative PCR analysis of actin and CWP1 expression, respectively. Values are presented as fold change over time zero, **p = 0.0011, ***p<0.0001.

