
Figure 3.
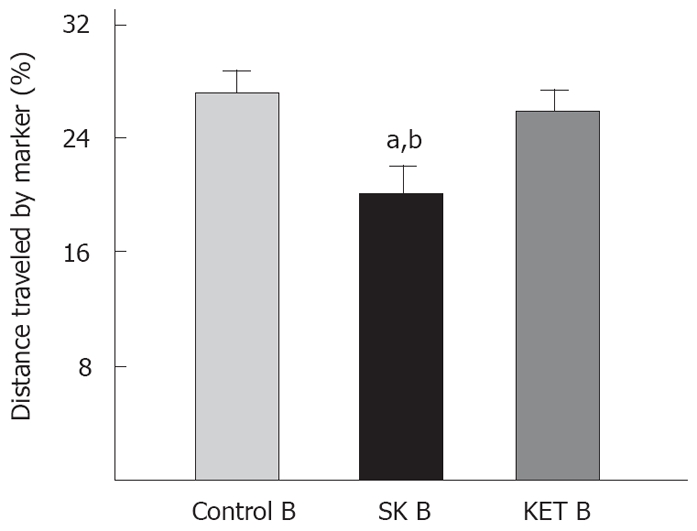
Bar diagram illustrating the distance travelled by the marker, expressed as a percentage of total intestinal length from pylorus to cecum. Intestinal I/R caused transit delay that was corrected by the administration of ketamine as anesthetic. aP = 0.00019 vs control B; bP = 0.0004 vs KET B.