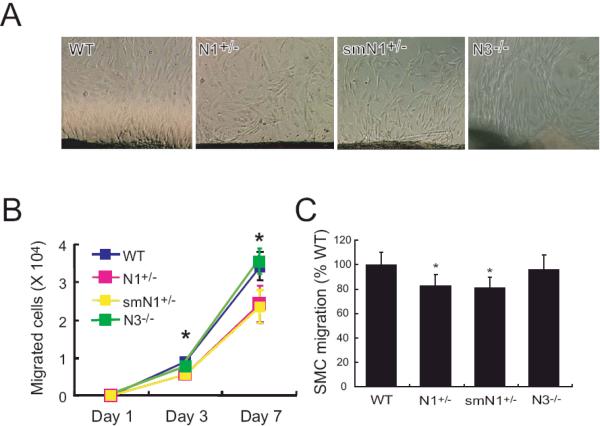
Figure 3. Migration of SMC in Notch mutant mice.
A. Micrographs of SMC migration from aortic explants from WT, N1+/-, smN1+/-, and N3-/- mice.
B. Quantification of SMC migration from aortic explants of WT, N1+/-, smN1+/-, and N3-/- mice. n=8, *; P<0.05
C. SMC chemotaxis in response to serum stimulation (percent of migrated WT SMC). n=12, *; P<0.05, vs. WT

