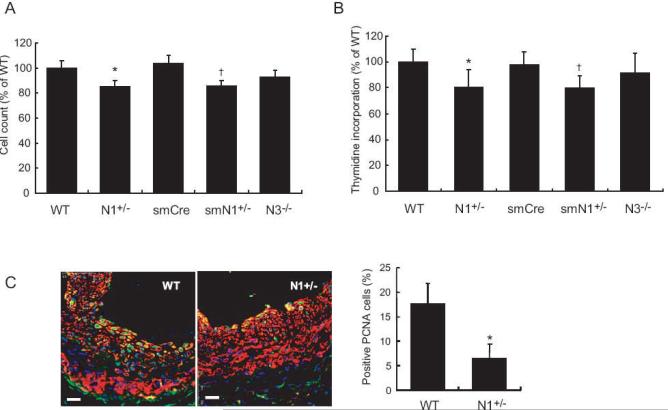
Figure 4. Proliferation of SMC in Notch mutant mice.
A. SMC proliferation in response to serum after 3days (percent of WT SMC). n=10, *; P<0.05, vs. WT; †; P<0.05, vs. smCre-Tg
B. [3H]Thymidine incorporation (percent of incorporation of WT SMC). n=6, *; P<0.05, vs. WT; †; P<0.05, vs. smCre-Tg
C. Left panel: Co-staining for SMA (red) and PCNA (green) 14 days after ligation injury in WT and N1+/- mice. White scale bar was 20 μm. Right panel: Quantification of PCNA positive cells in neointima of WT and N1+/- mice. n=6; *; P<0.05, vs. WT

