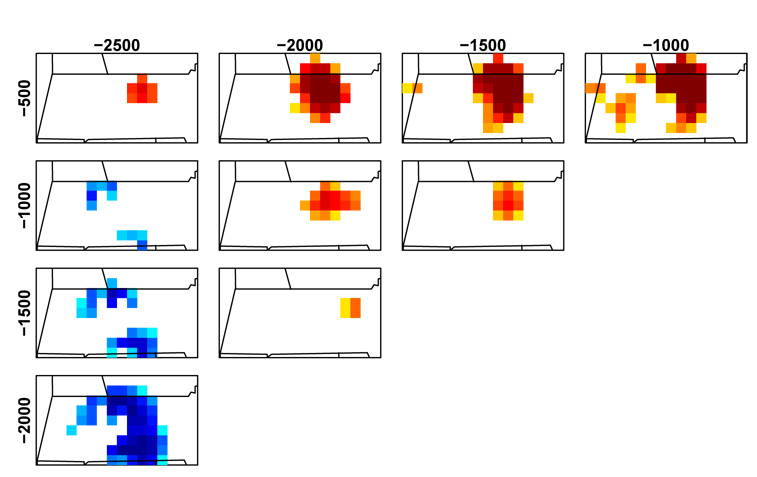
Figure 6.
Posterior probabilities of differences in pre-settlement oak abundance between pairs of time points 500 to 2500 years before present (1950) based on colonial parameter estimates. Each cell indicates the posterior probability (with a threshold of 90%) that the cell has lower (blue) or higher (red) abundance in the later time period than the earlier time period. See Fig. 4, third column for color legend.

