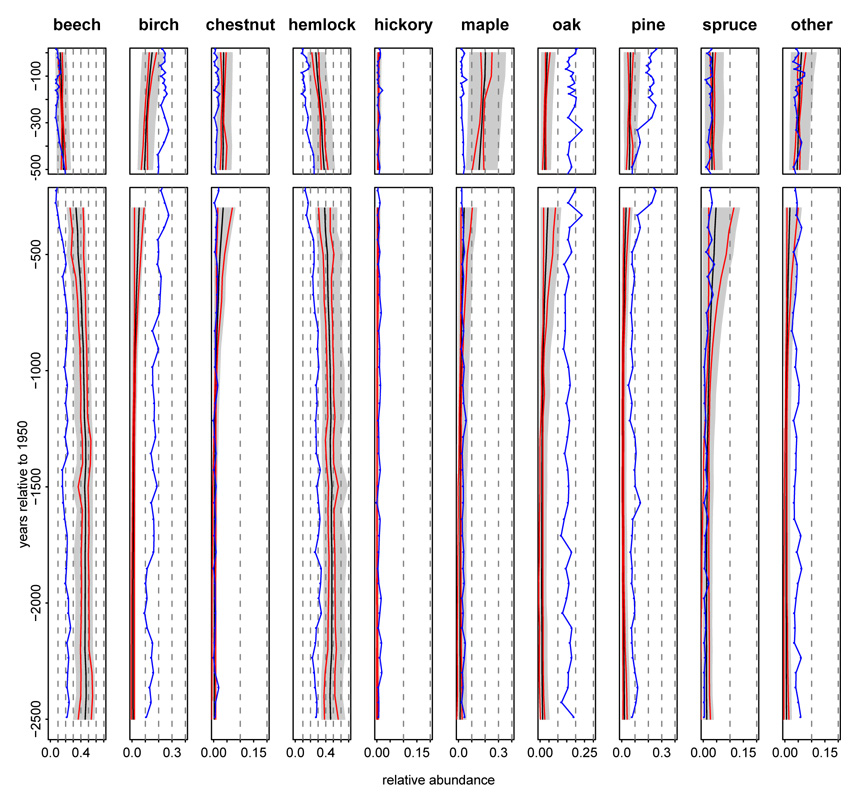
Figure 7.
Vegetation diagrams for the grid cell encompassing pond 20 (Snake Pond) with the recent period based on modern parameter estimates (top; 0 to 500 years before present) and the pre-settlement period based on colonial parameter estimates (bottom, 300 to 2500 years before present). Black lines represents the posterior mean and gray shading the 95% credible intervals for vegetation abundance, rp(s, t), with blue lines showing corresponding pollen proportions from Snake Pond. Red lines represent 95% pointwise credible intervals for the deviations over time in the vegetation (rp (s, t) − r̄p (s)), which are plotted as offsets relative to the posterior mean of r̄p(s). Plotting the credible interval for the deviation in this way removes the effect of uncertainty in ϕp, which affects all times in the same way, and avoids the overly conservative contrasts of abundance across time indicated by the gray shading.

