
Figure 3.
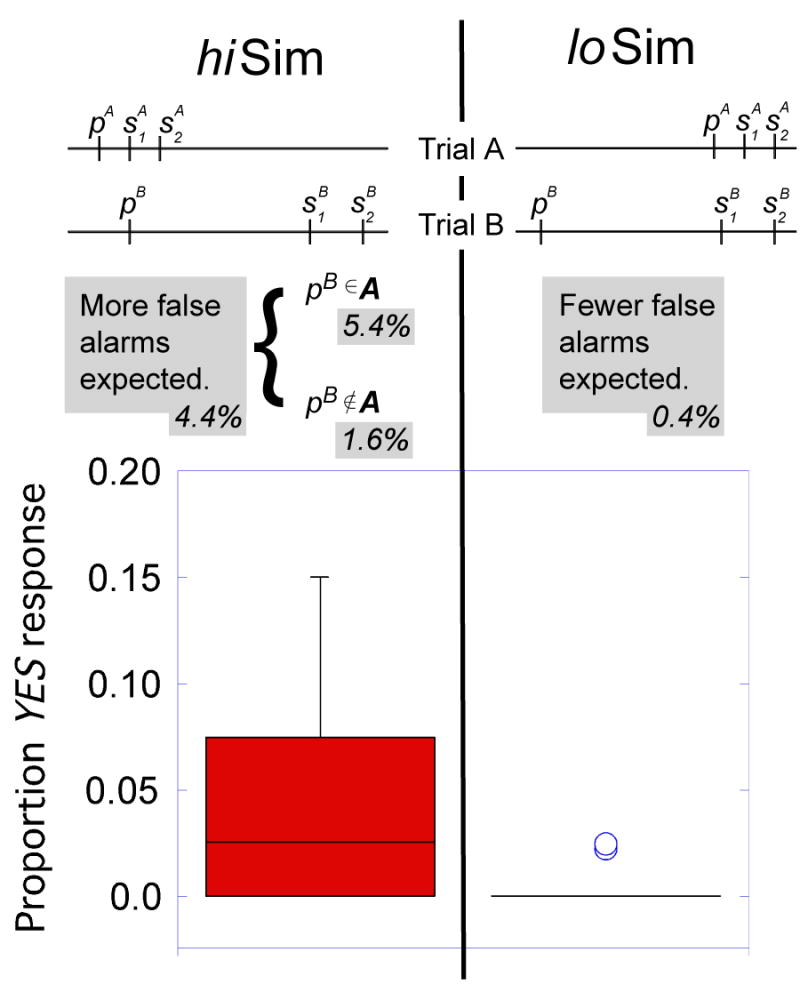
Upper panel: Schematic diagram of design examining maintenance of item information across trials. Trial A immediately precedes Trial B. In the hiSim condition, the probe for Trial B (with value pB) is very similar in perceptual space to the stimuli from Trial A (study stimuli and, with probe, and , with probe, pA). The horizontal axis represents the stimulus space, items closer to each other are more similar. In the loSim condition, pB is different from , and pA. If item information were maintained from trial to trial, more false alarms (on Trial B) would be expected for the hiSim condition, as interference between the probe and stimuli from a previous trial should be greater in that condition than the loSim condition. Note that Trial B is the same in each case. p indicates the probe frequency, s1 and s2 indicate the frequencies of the first and second study stimuli. Within the hiSim condition, on some trials pB matched a stimulus from Trial A (pB ∈ A), while on other trials, pB did not match any stimulus from Trial A (pB ∉ A). The percentage of false alarm trials observed for each condition are shown in filled boxes. Lower panel: Box plot shows median (thick bar); middle 50% of data are encompassed by boxes. The whiskers include all data points that are not outliers. Circles represent outliers, defined as points >1.5× the inter- quartile range from the median. Note that more false alarms were made in the hiSim condition.