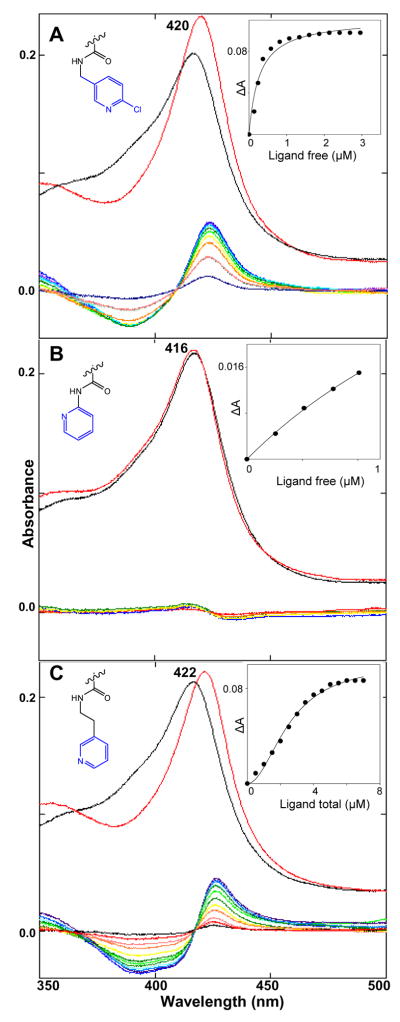
Figure 2. Spectral responses of TCCYP51 (2 μM) to three INDO-amide derivatives.
(A) 18; (B) 16; (C) 20. Upper spectra: Absolute absorbance in the Soret band region (black line – no ligand, red line – plus ligand. Lower: Difference spectra upon titration with the ligands (0.5 μM steps). Insets: Titration curves.

