
Figure 6.
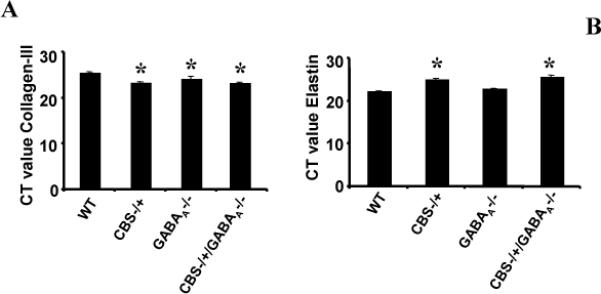
Represents Ct values for Collagen-III (A) and Elastin (B) in WT, CBS-/+, CBS-/+ / GABAA -/- and GABAA -/-. Lesser the value of Ct represents more the quantity of gene. One Ct difference signifies two fold increases in gene quantity. There is significant increase in collagen-III and decrease in elastin expression or decrease in Ct values for collagen-III and increase for elastin. The bar graph represents mean ± SEM in three experiments. *p<0.05 compared to WT.