
Figure.
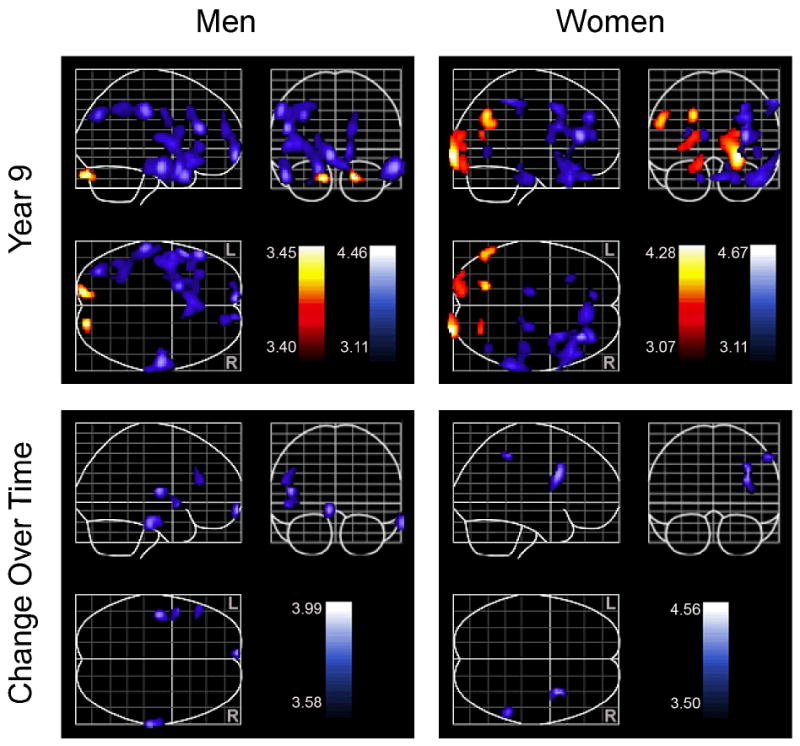
Cross-sectional (upper portion) and longitudinal (lower portion) associations between average Center for Epidemiologic Studies Depression Scale (CES-D) and blood flow. Cross-sectional associations are based on year 9 data. Positive associations between blood flow and CES-D scores are shown in red. Negative associations between blood flow and CES-D scores are shown in blue. Color bars represent the t-value of associations between blood flow and CES-D.