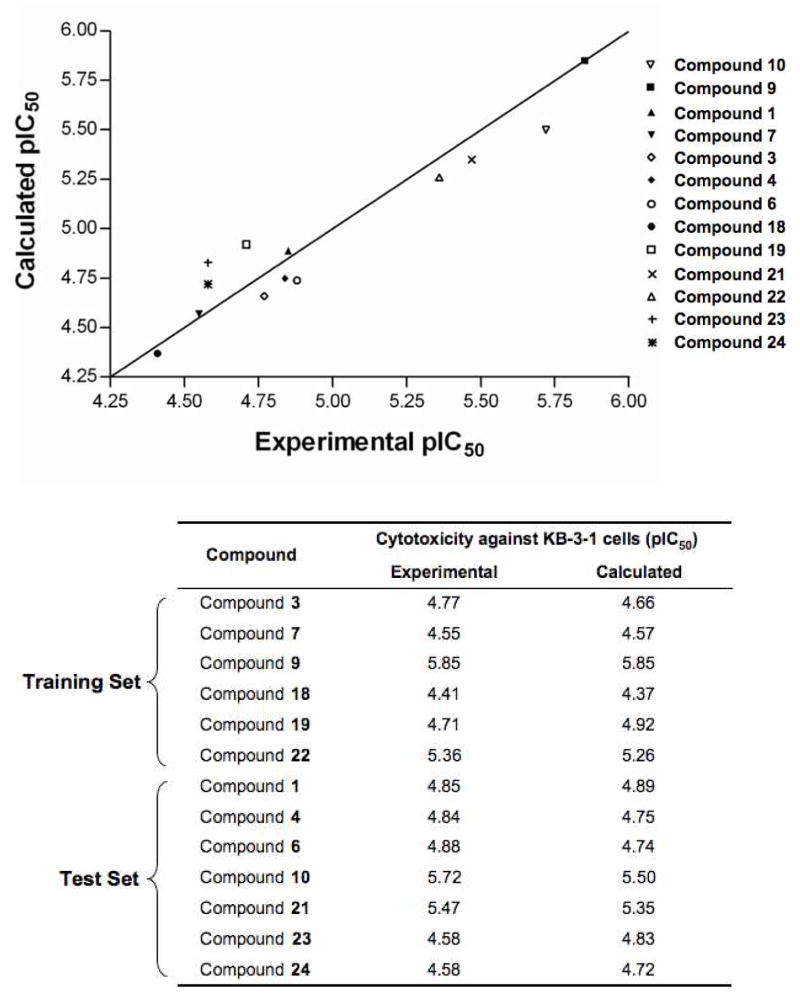
Figure 4.
Pharmacophores predict cytotoxicity and selectivity a). Scatter plot and comparison of the KB-3-1 cytoxicity QSAR model applied to thirteen active thiosemicarbazones. The training set correlation is characterized by one partial least-square (PLS) factor (SD = 0.12, R2 = 0.96). The test set correlation is characterized by one PLS factor (Root mean-square error (RMSE) = 0.16, q2 = 0.85, Pearson-R = 0.95). Experimental and calculated pIC50 values are shown for the QSAR training and test set. B). Scatter plot and comparison of the KB-V1 cytoxicity QSAR model applied to twelve active thiosemicarbazones. The training set correlation is characterized by one PLS factor (SD = 0.11, R2 = 0.91). The test set correlation is characterized by one PLS factor (RMSE = 0.29, q2 = 0.42, Pearson-R = 0.70). Experimental and calculated pIC50 values are shown for the QSAR training and test set.


