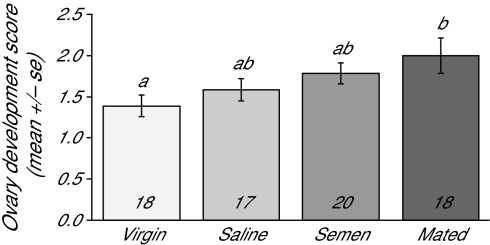
Figure 2.
Ovary activation. Abdomens of queens were dissected and the amount of ovary activation was assessed, as described in the Materials and Methods section and in Kocher et al. (2008). There were significant differences in ovary activation among the groups (One-way ANOVA, P = 0.0385), with post hoc pairwise comparisons with Tukey adjustments revealing that naturally mated queens (denoted “mated” in the graph below) had the highest ovary activation scores, virgin queens had the lowest, and 2 inseminated groups (“saline” and “semen”) had intermediate scores. The number of queens is shown in the bottom of the bars, and different letters denote significant differences (Tukey honest significant difference technique, P < 0.05).

