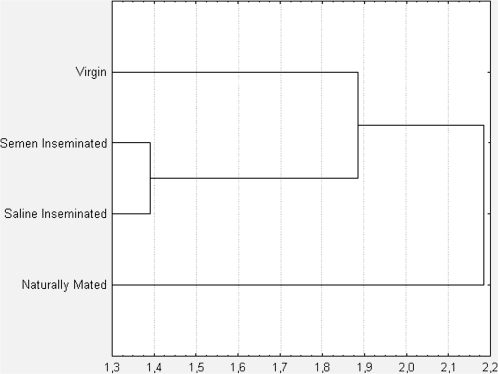
Figure 4.
Clustering of queen sample groups using mandibular gland chemical profiles. The mean relative proportion of each chemical identified in the mandibular glands extract for each of the 4 groups of queens (virgin, saline-inseminated, semen-inseminated, and naturally mated) was calculated. The average values for all the identified chemicals were used to produce a dendrogram using Euclidean distance.

