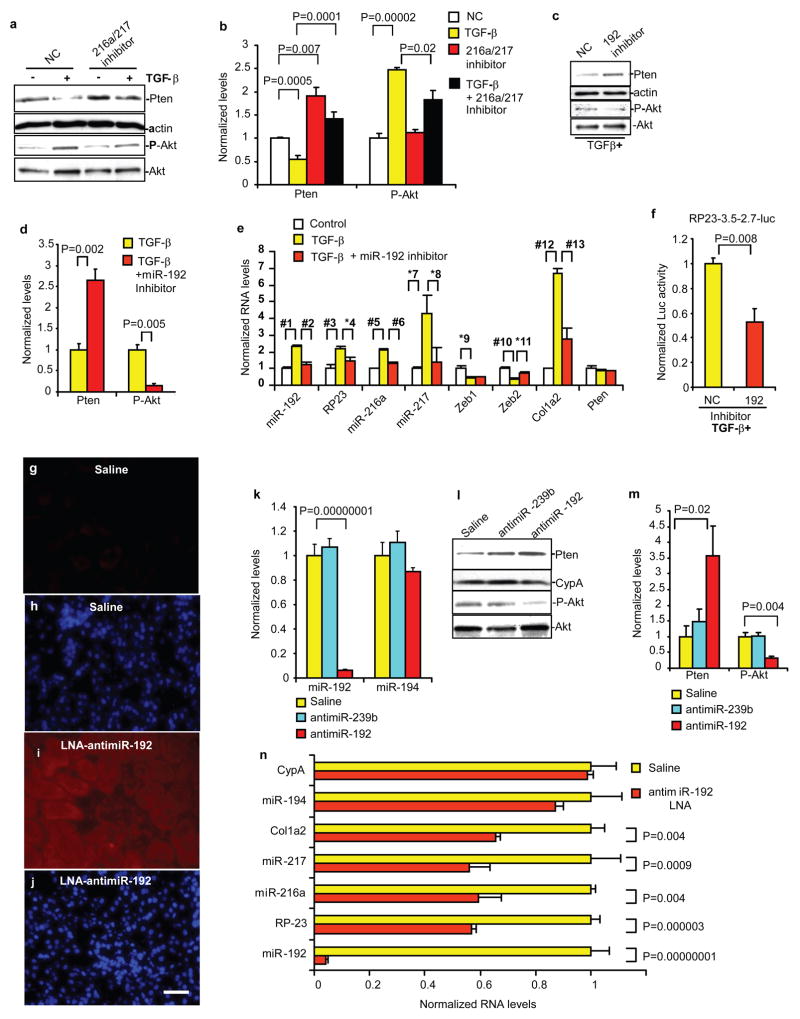
Figure 3. Effects of miR inhibitors on downstream signaling in vitro and in vivo.
a,b, Effects of miR-216a and miR-217 inhibitors (10nM) on endogenous Pten, P-Akt levels (Western blots) in MMC treated with or without TGF-β. NC, negative control (n=3). c,d, Effects of miR-192 inhibitor (10nM) on TGF-β induced effects on Pten and P-Akt in MMC. MMC were transfected with inhibitors and then treated with TGF-β, followed by Western blotting (n=3). e, Effects of miR-192 inhibitor on endogenous RNA levels of miR-192, RP23, miR-216a, miR-217, Zeb1, Zeb2, Col1a2 and Pten in MMC treated with TGF-β (qPCRs, *, p<0.05; #, p<0.01, n=3). #1, p=0.005; #2, p=0.001; #3, p=0.001; *4, p=0.02; #5, p=0.006; #6, p=0.0007; *7, p=0.02; *8, p=0.02; *9, p=0.04; #10, p=0.01; *11, p=0.02; #12, p=0.002; #13, p=0.003. f, Effects of miR-192 inhibitor on TGF-β-induced RP23 promoter (RP23-3.5-2.7k-luc) activity in MMC (n=4). g–j, In vivo delivery of LNA-antimiR-192. LNA-antimiR-192 was subcutaneously injected (2.5 mg/kg) into normal C57BL/6 mice and renal cortical tissues harvested 6hr later. Representative data of in-situ hybridization to detect LNA-antimiR-192 in mouse renal cortical sections 6hr after injections. Very feeble fluorescence was detected in the kidney of control vehicle saline-injected mice (saline, g). Intense and widespread fluorescence in kidney glomerular and tubular compartments was observed in LNA-antimiR-192 injected mice (i). DAPI staining of kidney cortex of saline and LNA-antimiR-192 injected mice respectively (h,j). Scale bar, 20 μm. k, qPCRs of cortical tissues obtained from normal C57BL/6 mice injected subcutaneously with 2.5 mg/kg LNA-antimiR-192, LNA-antimiR-239b (targeting C. elegans miR-239b) or saline. Significant decrease in RNA levels of miR-192, but not miR-194, was observed with LNA-antimiR-192, while no change with saline or LNA-antimiR-239b. l,m, Concomitant significant increase in Pten protein levels and decrease in P-Akt levels (P-Akt to total Akt ratios) by LNA-antimiR-192 but not by LNA-antimiR-239b. n, Significant decrease in RNA levels of miR-192, RP23, miR-216a, miR-217, and Col1a2, but no change in miR-194 or CypA in LNA anti-miR-192 injected mice. (n=3). Bar graph data expressed as mean and s.e.m. Full or larger scan blots of a,c,l are shown in Supplementary Fig. S7.

