
Fig 5.
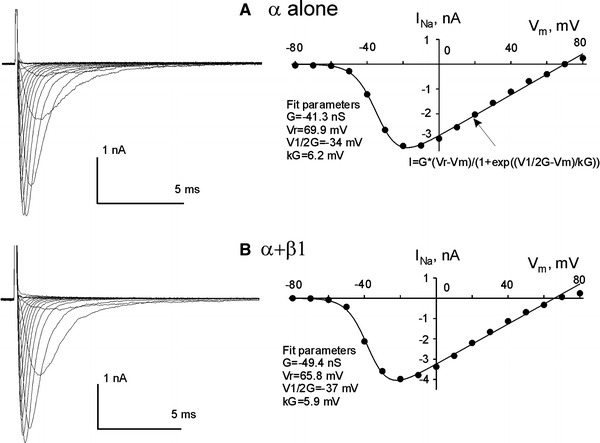
Voltage–current relationship for heterologous expressed Nav1.5 (α alone a, or with the β1 subunit b). a, b Left panels raw current recordings at different membrane potentials, right panels data point plots, with the fits (solid lines) to Eq. 1 (“Methods”). The equation is given in a, and fit values for the steady-state activation are indicated on the plots in a and b. The statistical data for the steady-state activation are given in Table 1