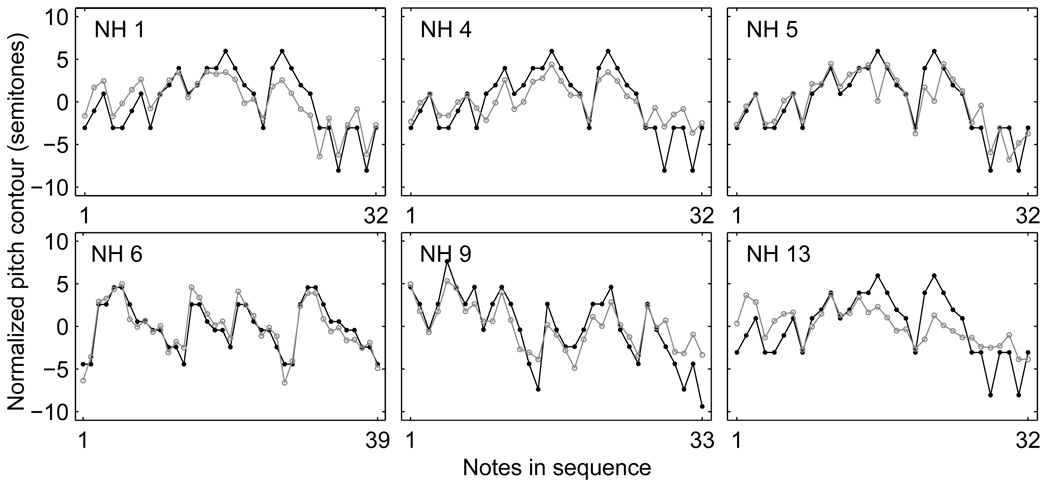
Fig. 1.
Pitch contours for six randomly-chosen, normal-hearing children. Each panel shows data from one child. The black lines and filled symbols represent the target songs. The gray lines and open symbols represent the pitch contours of the songs produced by the subjects. The rhythm information was removed. For each subject, both the target song and the recorded song were normalized to their respective means.

