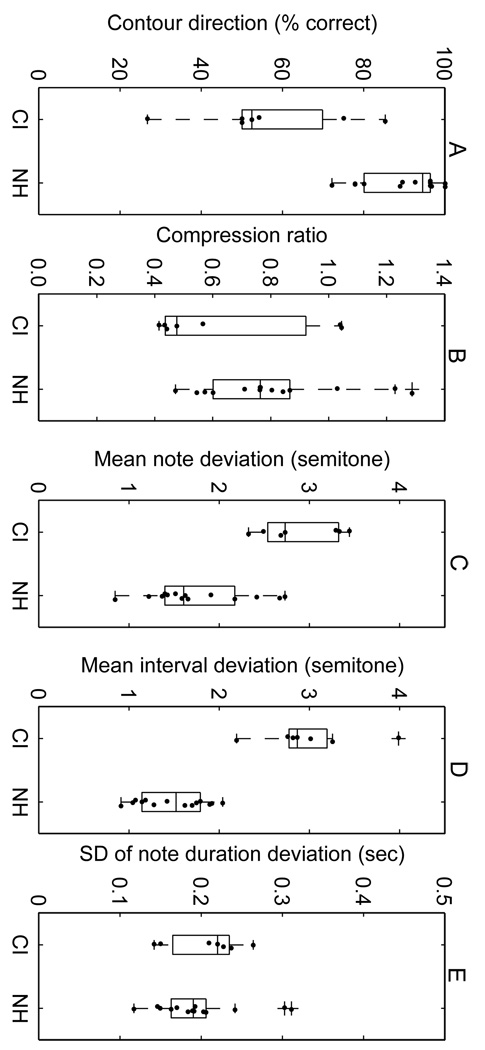
Fig. 3.
Five metrics used for evaluating singing in the two subject groups. The results of the five metrics are plotted in five panels including: A. contour direction, B. compression ratio, C. mean note deviation, D. mean interval deviation, and E. standard deviation of note duration difference. Performance of the children with cochlear implants is always plotted on the left and that of the normal-hearing children on the right. Each box plot shows the upper limit, upper quartile, median, lower quartile, and the lower limit of the data. Outliers of the data are shown with crosses.

