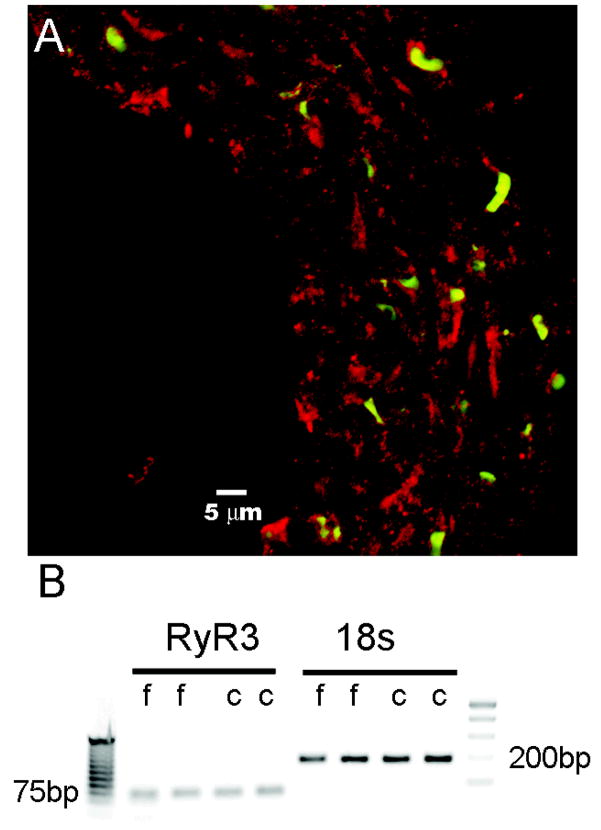
Figure 1.
Ryanodine Receptor Expression. A, cross-section of rat basilar artery immunostained for ryanodine receptor (red) and a nuclear counterstain (green). B, Agarose gel electrophoresis of PCR products from 2 samples of femoral (f) and cerebral (c) arteries. The left panel shows a 70 bp PCR fragment of the RyR3 sequence and the corresponding loading control of 18s rRNA in the right panel. Closest ladder bands to amplicon fragments are labeled 75 bp and 200bp, respectively.

