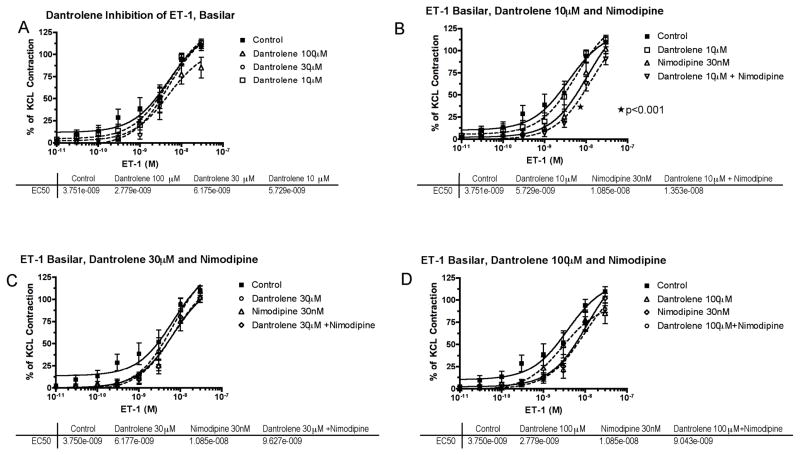
Figure 4.
Endothelin-1 (ET-1) concentration-response curves in basilar artery. A, Cumulative concentration-response curve of basilar artery constriction normalized to 100 mM KCl induced-contraction, control arterial segments are compared to segments incubated with increasing concentration of dantrolene (10–100μM). B, The effect of dantrolene (10μM) plus nimodipine (30nM) (*EC50 of nimodipine compared to control). C, The effect of dantrolene (30μM) plus nimodipine (30nM) shows no interaction. D, The effect of dantrolene (100μM) plus nimodipine (30nM) shows no interaction. The effective concentration of ET-1 that gave 50% contraction (EC50) for each treatment is listed below the respective graph.

