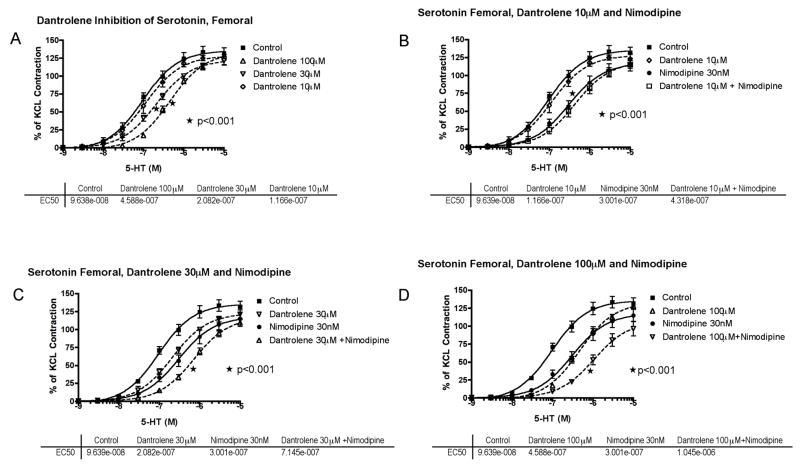
Figure 5.
Serotonin (5-hydroxytryptamine, 5-HT) concentration-response curves in femoral artery. A, Cumulative concentration-response curve of basilar artery constriction normalized to 100 mM KCl induced-contraction, control arterial segments are compared to segments incubated with increasing concentration of dantrolene from 10–100μM (*EC50 of 30 and 100 μM compared to control). B, The effect of dantrolene (10μM) plus nimodipine (30nM) (*EC50 of nimodipine compared to control). C, The effect of dantrolene (30μM) plus nimodipine (30nM) (*EC50 of dantrolene+nimodipine compared to nimodipine or dantrolene alone). D, The effect of dantrolene (100μM) plus nimodipine (30nM) (*EC50 and Emax of dantrolene+nimodipine compared to nimodipine or dantrolene alone). The effective concentration of 5-HT that gave 50% contraction (EC50) for each treatment is listed below the respective graph.

