Figure 2.
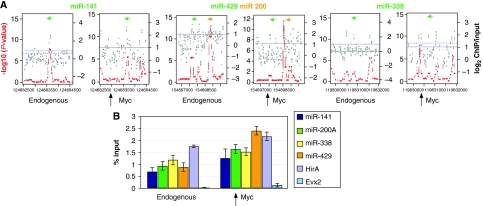
Association of c-Myc with genomic regions proximal to miRNA genes. (A) c-Myc genomic binding was assessed by ChIP–chip analysis. ACME statistical analysis (–log10 P-value scale on left side of each panel), plotted as red dots, indicates statistically significant enrichment. The ACME data are derived from the fold enrichment ratios (log2 scale on the right side of each panel) representing the ChIP enriched versus total input genomic DNA for all probes within the indicated genomic regions and plotted as grey dots. x axis represents the genomic region surrounding the miRNA loci with tiling oligonucleotide probes on a custom-designed tiling array. Positions of the mature miRNA transcripts are indicated by green or orange bars. Arrows indicate direction of transcription. (B) c-Myc binding at microRNA loci. qChIP–PCR was carried out as described in Materials and methods using AK7 mES cells. Shown is endogenous c-Myc binding to the known c-Myc target gene HirA as a positive control. The Evx2 locus was used as a negative control. Analysis of Myc binding to the indicated miRNA genomic loci was carried out using ChIP from wild-type ES cells (endogenous) as well as ES cells overexpressing c-Myc (overexpression). Equal amounts of anti-c-Myc ChIP DNA and total input DNA were used for quantitative PCR using SYBR Green detection with an ABI7900HT system. The sequences of all primers for qChIP–PCR were based on the Myc-binding sites (100–200 bp from microRNA coding regions) identified from ChIP–chip analysis and are available on request. Bar heights represent the Myc-bound DNA as a percentage of the total input DNA as determined from four independent sets of experiments.

