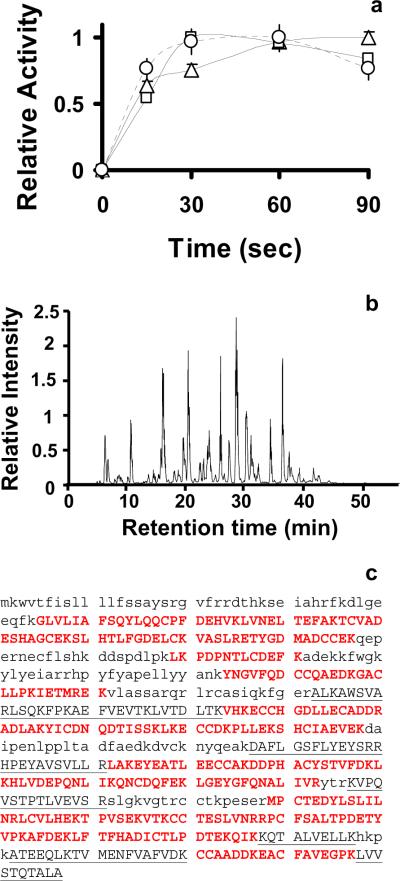
Figure 1.
a) Comparison of the relative absorbance at 405 nm due to the hydrolysis of LBAPNA by trypsin at different ultrasonic powers: 1.5%, 2% and 2.5%. Triangles correspond to 1.5% intensity, squares to 2%, and circles to 2.5%. Two technical replicates were performed for each time point. b) Chromatogram corresponding to the LC-MS/MS of BSA digests applying the HIFU protocol using a 3 min reduction and alkylation with 5 mM TCEP and 40 mM IAA, followed by a 1 min digestion. c) Amino acid sequence coverage for BSA. Capital letters correspond to the identified sequence. Red letters correspond to the identified cysteine-containing peptides.

