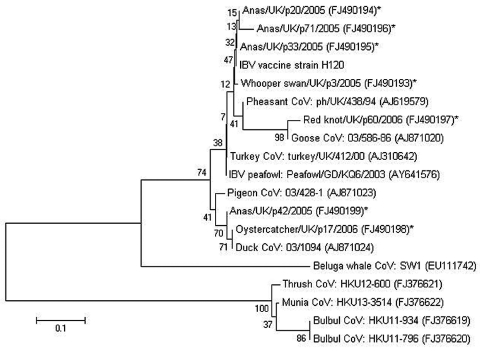
Figure.
Minimum-evolution tree (11) of coronaviruses based on a 146-bp fragment of the 3′ untranslated region of infectious bronchitis virus (IBV). Evolutionary distances were computed by using the Tamura-Nei method (12) and are in the units of the number of base substitutions per site. Coronaviruses detected in wild birds by this study are denoted with an asterisk. Previously published coronavirus sequences from different sources were included for comparative purposes. GenBank accession numbers are shown in brackets. The percentage of replicate trees in which the associated taxa clustered together in the bootstrap test (1,000 replicates) is shown next to the branches (13). The tree is drawn to scale; branch lengths are in the same units as those of the evolutionary distances used to infer the phylogenetic tree. Phylogenetic analyses were conducted in MEGA4 (10). CoV, coronavirus. Scale bar indicates nucleotide substitutions per site.

