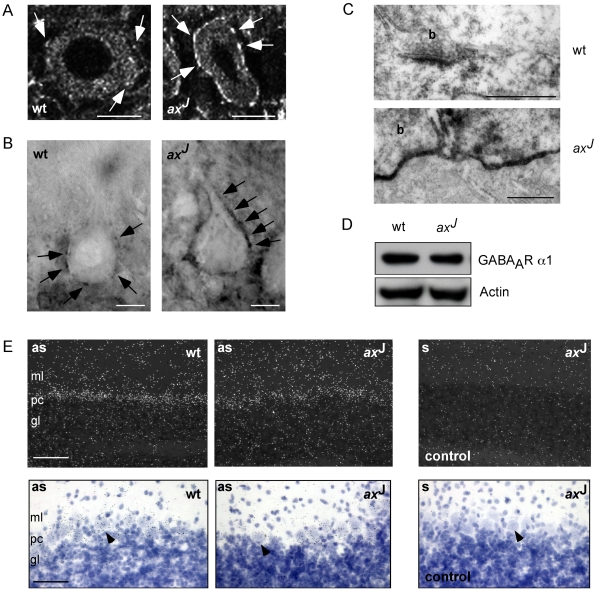
Figure 2. α1-containing GABAARs are redistributed in PCs of ax J mice.
GABAAR α1 staining of PCs in slices of wt or ax J mice using Cy3- (A) or biotin- (B) labeled secondary antibodies. Scale bars: 20 µm. (C) EM analysis of GABAAR α1 using biotin-coupled secondary antibodies. Scale bars: 500 nm. (D) Western blot analysis of protein extracts from wt or ax J cerebella reveals that the effects seen in (A–C) represent a receptor redistribution rather than a change in total gene expression. Actin serves as a loading control. (E) In situ hybridisation using GABAAR α1 oligonucleotides revealed comparable mRNA levels in PC somata (arrows) as well as in dendrites of wt and ax J mice shown in dark (upper panels, white dots) and bright (lower panels, blue dots) field images. Nuclei were visualized by Hämalaun staining. Note that GABAAR α1 mRNA signals were absent upon use of sense control oligonucleotides (right panels). Scale bar, upper panel: 100 µm. Scale bar, lower panel: 50 µm. gl: granular layer; ml: molecular layer; pc: Purkinje cell layer.

