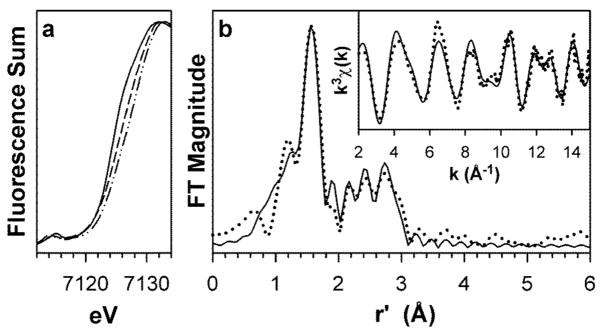
Fig. 3.
X-ray absorption spectra of complexes 1, 2 and 3. (a) X-ray absorption edge spectra of 1 (–––), 2 (– – –), and 3 (–··–··–), showing the blue-shift of the Fe K-edge transition with progressive oxidation of the iron centers. (b) Fourier transform of the Fe K-edge EXAFS data (k3χ(k)) and unfiltered EXAFS spectra (k3χ(k), inset) of 3. Experimental data is shown with dotted (······) lines and fits with solid (–––) lines. Fourier transformation range, k = 2.0 – 15.0 Å−1. Fit parameters are shown in bold italics in Table S4 of the Supplementary Information.

