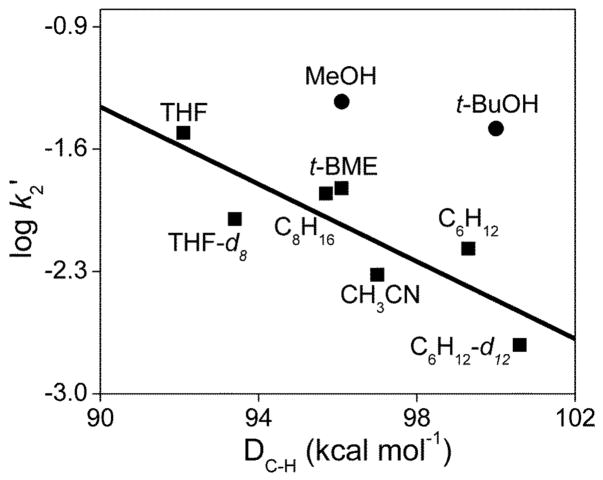
Fig. 5.
Oxidative reactivity study of 3 in CD3CN at 10 °C. The solid line represents the best linear fit correlating the log k2′ values for the reactions of hydrocarbons with 3 (■) with their C-H bond dissociation energies. k2′ is the normalized second order rate constant (second order rate constant k2 divided by the number of equivalent C-H bonds on the substrate that may be attacked by 3). For MeOH and t-BuOH, the filled circles (●) represent the values assuming that a C-H bond is attacked. DC-H values were obtained from refs 18, 24 and 39.

