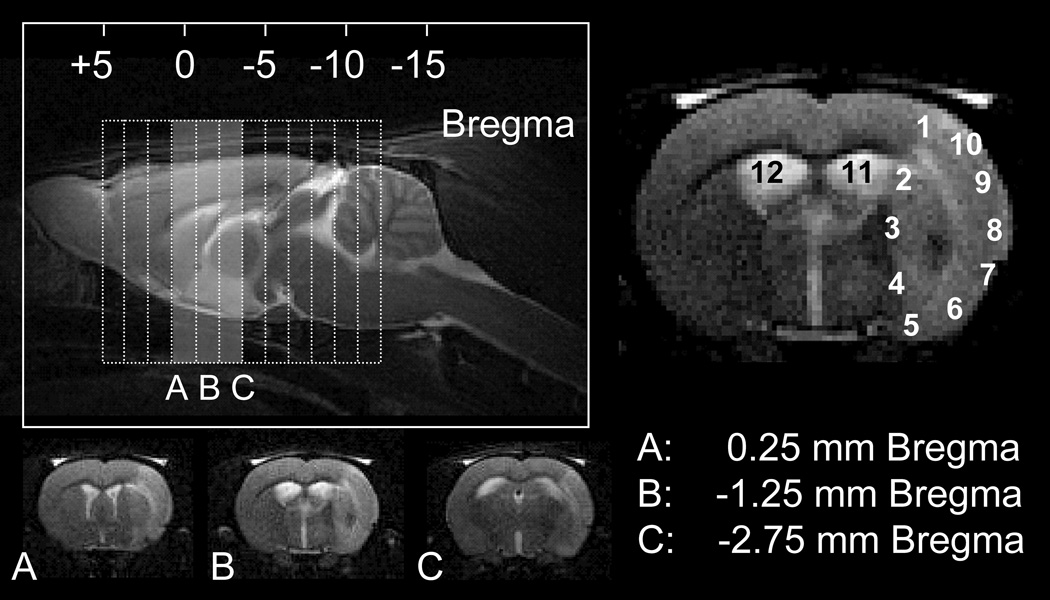
Figure 2. Schematic of imaging slice selection and corresponding immunohistochemistry.
Top left: sagittal T2-weighted image with slice package (dotted lines) for T2-weighted and diffusion-weighted imaging. Bottom left (A–C): T2-weighted images corresponding to the central three imaging slices (shaded area). For ED-1, ED-2, IBA, and PB staining, 20× photos were taken at three locations with respect to bregma (+0.25,−1.25,−2.75). For each location, twelve regions were investigated (numbered 1–12), ten along the lesion periphery and two within the lateral ventricles.

