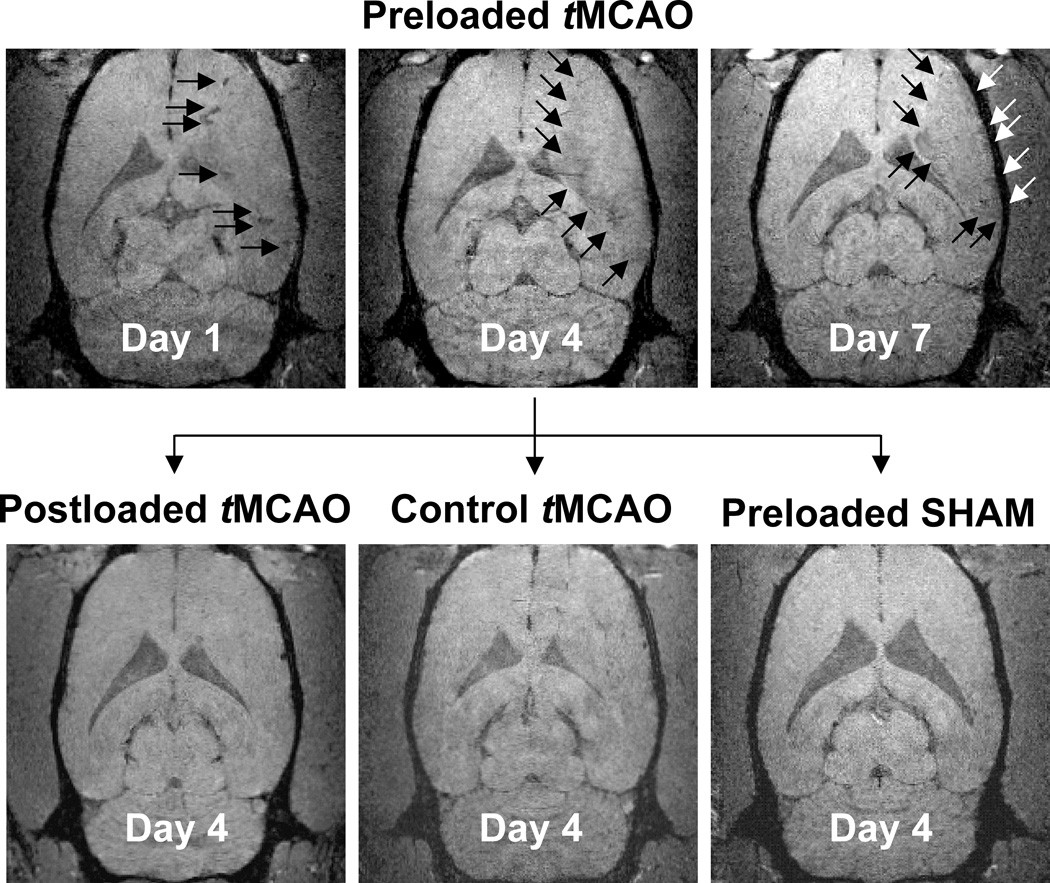
Figure 3. Feridex Visualization of the Inflammatory Response.
Day 1, 4, and 7 coronal GRE images for Group 1: 7-day Preloaded tMCAO (top row). Vasodilation and blood vessel darkening was evident on day 1 (top left). Marked hypointensity developed along the lesion periphery, reaching a maximum by day 4 (top middle), and remaining present through day 7 (top right). Day 4 coronal GRE images for Group 2: Postloaded tMCAO (bottom left), Group 3: Control tMCAO (bottom middle), and Group 4: Preloaded SHAM (bottom right). The GRE signal decrease along the lesion periphery (top middle) was significantly greater in magnitude than the 7d-preloaded SHAM group (bottom right). The GRE signal decrease within the lesion core was not statistically different than the 7d-preloaded SHAM group (p ≥ 0.183).

