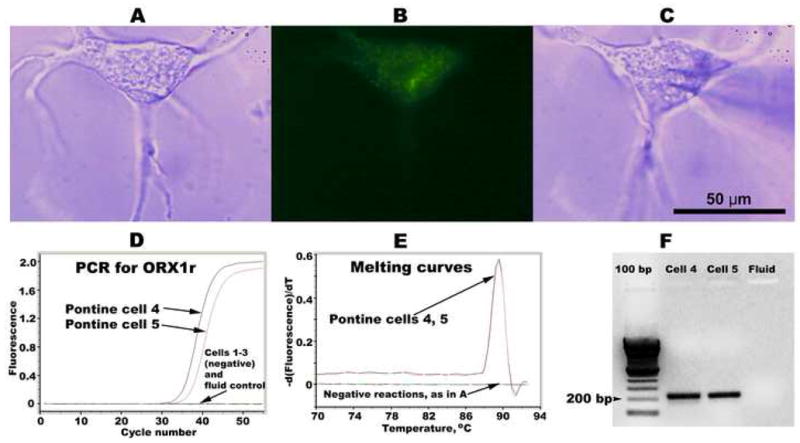
Figure 2.

Example of a dissociated and plated dorsomedial pontine cell that was retrogradely labeled from the medial medullary reticular formation (A–C), and results of the second round of real-time cDNA amplification with the material from a set of pontine cells (D–F). A: a dissociated cell, as seen under phase contrast illumination. B: the same cell seen under fluorescent illumination contains FITC-labeled beads transported from the medial medullary reticular formation. C: the same cell with a polished glass pipette placed in position for cell collection. D: real-time PCR curves for a set of five pontine cells and one control sample containing culture medium only; two of the cells in this set were positive for ORX1r cDNA. E: melting curves for the cDNA products from the reactions shown in D. F: gel display of selected PCR products obtained in the reactions shown in D.
