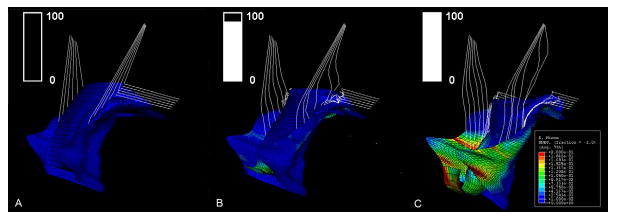
Figure 6.

(Left-to-right) a three-quarter, left, anterior view of the sequential development of a typical simulated cystocele during a gradually increasing load. In this simulation, the levator ani muscle had a 60% impairment, and apical and paravaginal support properties were set to having a 50% impairment. The color map shows the stress distributions in the different regions, with blue indicating a low stress region and red indicating a high stress region. The box on the up left coner shows the abdominal pressure (ordinate), increasing from zero to 100 cmH2O, over a time course (abscissa) corresponding to the three scenarios above.
