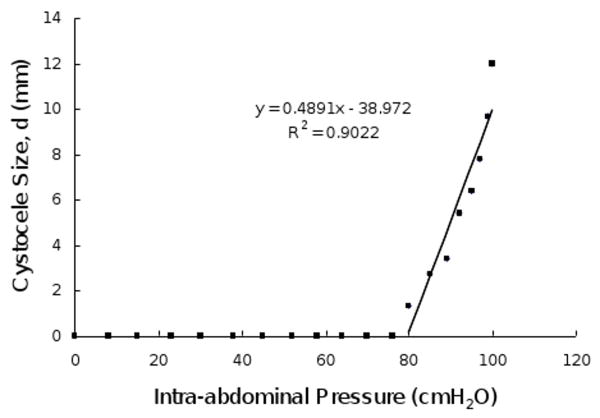
Figure 7.
Relationship between cystocele size and intra-abdominal pressure in a simulated cystocele. In this simulation, the levator ani muscle had a 60% impairment, apical and paravaginal support were set to having a 50% impairment. The best fit line for non-zero cystocele size data points is plotted. The linear regression equation and coefficient of determination are shown in the illustration.

