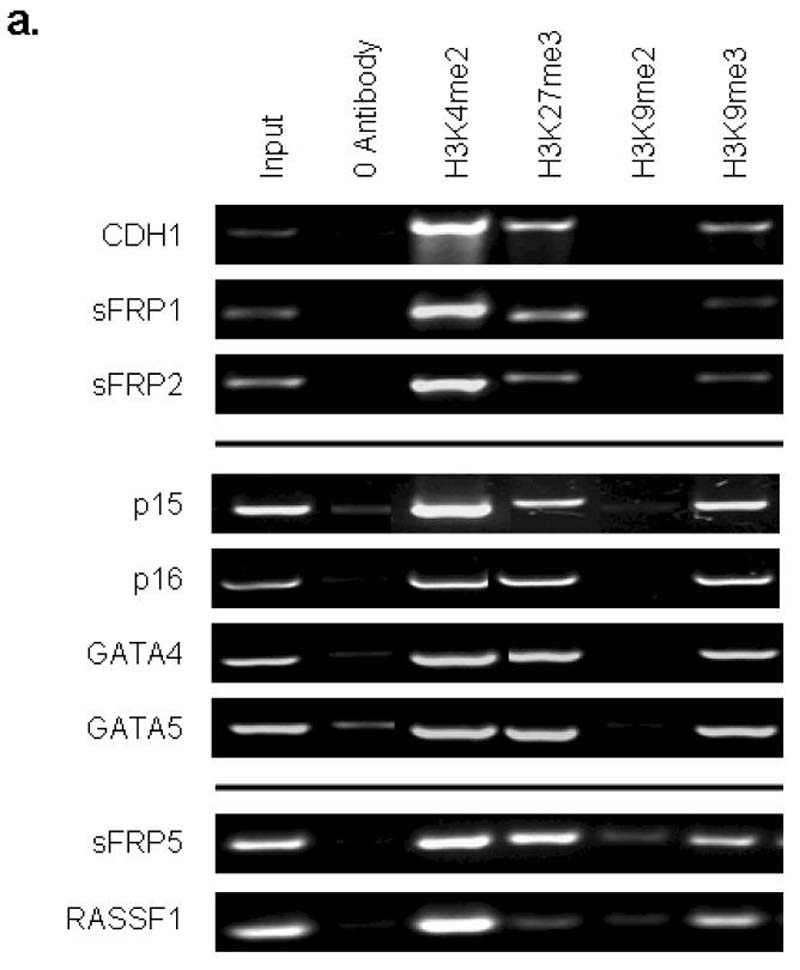
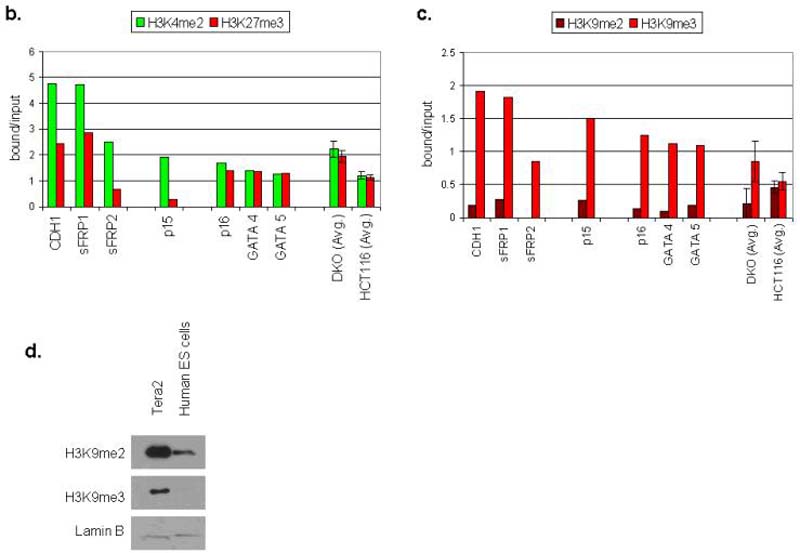
Figure 4. Genes studied in EC cells share the bivalent chromatin pattern seen in ES cells, but add additional repressive marks characteristic of these same genes when they are induced to DNA de-methylate in adult cancers.

a. Chromatin IP was performed using antibodies to H3K4me2, H3K9me27, H3K9me2, H3K9me3, on Tera-2 cells. PCR was performed for regions within the CpG islands, and near the transcription start sites of CDH1, sFRP1, sFRP2, p15, p16, GATA4, GATA5, sFRP5 and RASSF1. Representative results of two independent experiments are shown. A zero-antibody negative control is included for comparison. b. Quantitation of representative gels shown in Fig. 4a showing the ratio of H3K4me2 (active mark) and H3K27me3 (repressive mark) to input DNA in Tera-2 cells for CDH1, sFRP1, sFRP2, p15, p16, GATA4 and GATA5, and as an average for four of these genes (sFRP2, sFRP5, GATA4, GATA5) from previous studies6 of HCT-116 DKO and wild type cells (far right two columns). Error bars indicate standard errors. c. Ratio of H3K9me2 and H3K9me3 to input DNA in Tera-2 cells for CDH1, sFRP1, sFRP2, p15, p16, GATA4 and GATA5, and as an average for four of these genes (sFRP2, sFRP5, GATA4, GATA5) from previous studies6 in HCT116 wild type cells, where each of the genes is DNA hypermethylated and lacks any basal transcription, and HCT116 DKO cells where each gene has become fully DNA demthylated and is re-expressed6 (far right two columns). d. Western blot analysis for the repressive histone modifications, H3K9me2 and H3K9me3 in Tera2 cells and the human ES cell line WA01. Lamin B was used as a loading control.

