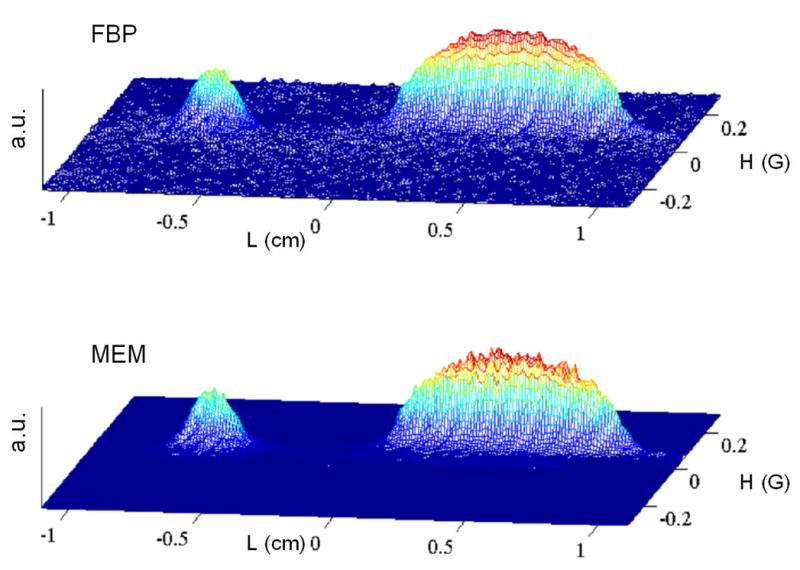
Figure 2.

2-D spectral-spatial EPR image of a small tube containing solid LiPc and a larger tube containing an aqueous solution of trityl-CD3. The centers of tubes were separated by 11 mm. Each of the 60 projection was averaged 5,000 times with scan frequencies of 1 to 8 kHz and a scan rate of 13.9 kG/s. A Hamming filter was used in conjunction with FBP. No filtering was used for reconstruction by CMEM algorithm. Statistics for the images are shown in Tables 1–3.
