
Figure 3.
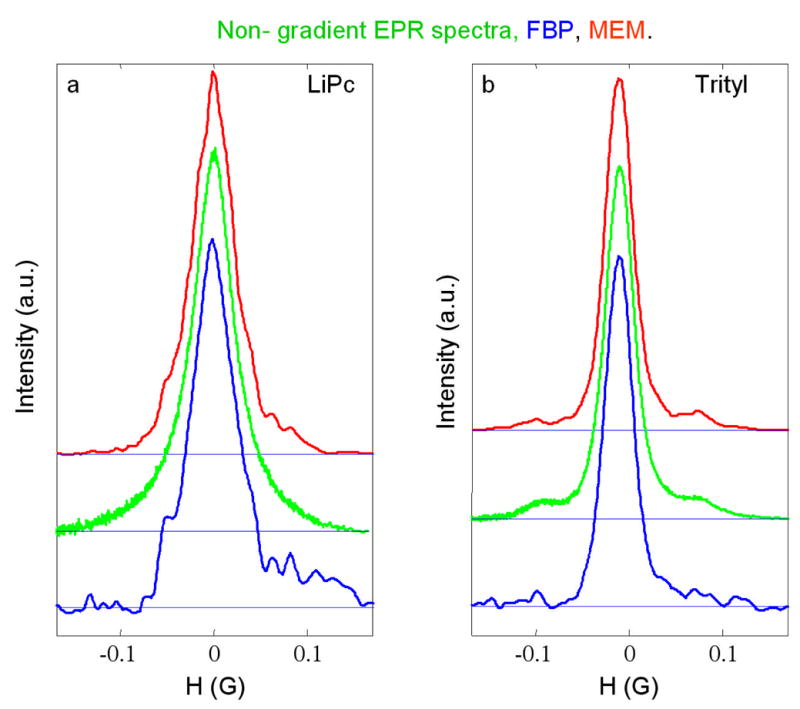
Spectral slices through the 2-D spectral-spatial image in Fig. 2 for (a) the LiPc signal and for (b) the trityl-CD3 signal at the positions for maximum signal intensity. The red (upper) and blue (lower) lines are from the images reconstructed by CMEM and FBP, respectively, and calculated by summing three slices. The green lines (middle) are the corresponding slow-scan lineshapes obtained by Fourier deconvolution of non-gradient rapid scans recorded with 500 Hz modulation frequency and a 0.6 G sweep width.