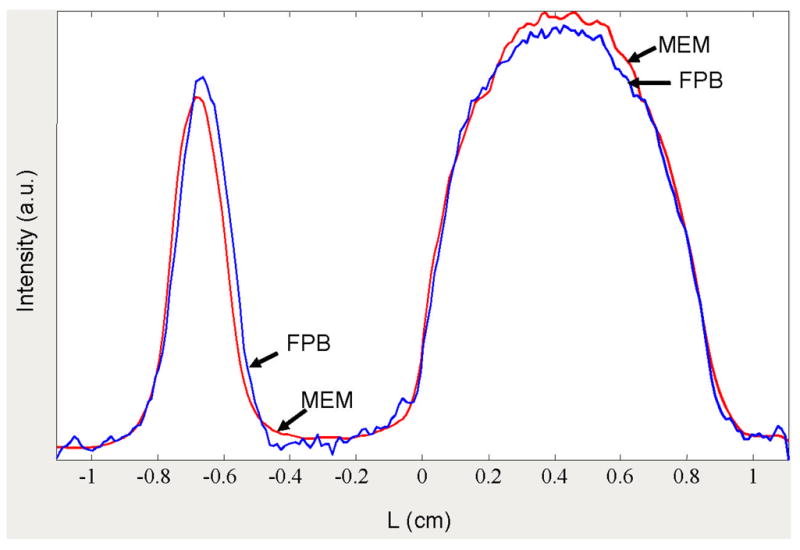
Figure 4.

Spatial profiles of the images shown in Fig. 2 obtained by the summation of numerical 2D image matrix along spectral axis. Red lines show MEM profile; blue lines show FBP profile.

Spatial profiles of the images shown in Fig. 2 obtained by the summation of numerical 2D image matrix along spectral axis. Red lines show MEM profile; blue lines show FBP profile.