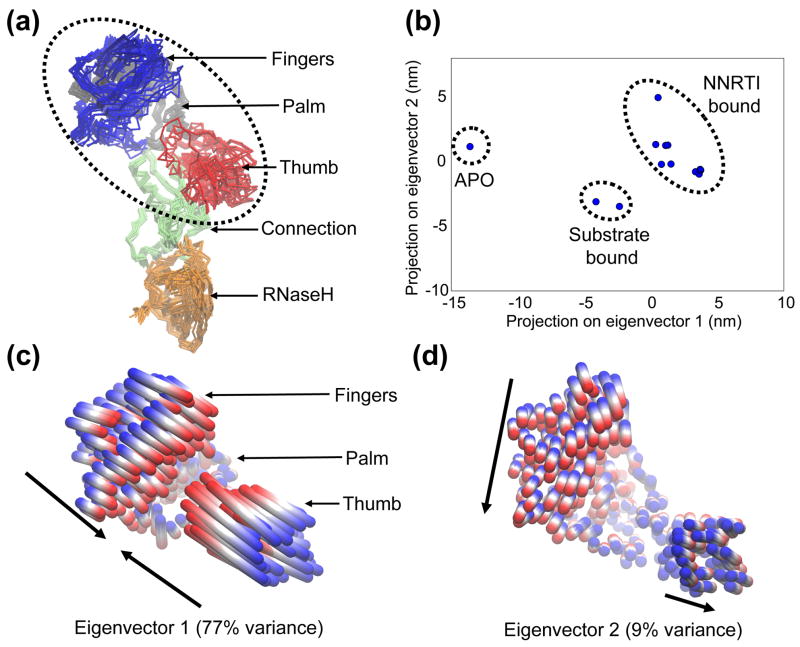
Figure 2.
Conformational changes of the “crystallographic ensemble” of RT x-ray structures, captured with PCA. (a) Superposition of the p66 subunits of each member of the ensemble. Protein is shown in Cα trace representation, with each subdomain colored individually. The region referred to as the “polymerase region” is circled, composed of the fingers, palm and thumb subdomains. (b) 2D projection of each structure onto the plane defined by the top two eigenvectors from PCA of the ensemble. The ligation state of each cluster of structures is indicated, with the PDB codes as follows: APO (1DLO); Substrate bound (1RTD, 2HMI); NNRTI bound (1VRT, 2ZD1, 1HNV, 1BQM, 1VRU, 1FK9, 1EP4, 1DTQ, 1RT4, 1RT1). (c) and (d) Collective motions of the polymerase region captured by eigenvectors 1 and 2. Motions are illustrated as linear interpolations between the extreme projections of the structures onto the eigenvectors. Each cylinder therefore describes the path of each Cα atom between the extremes (on a blue-white-red color scale). Arrows indicate the approximate direction of each subdomain.

