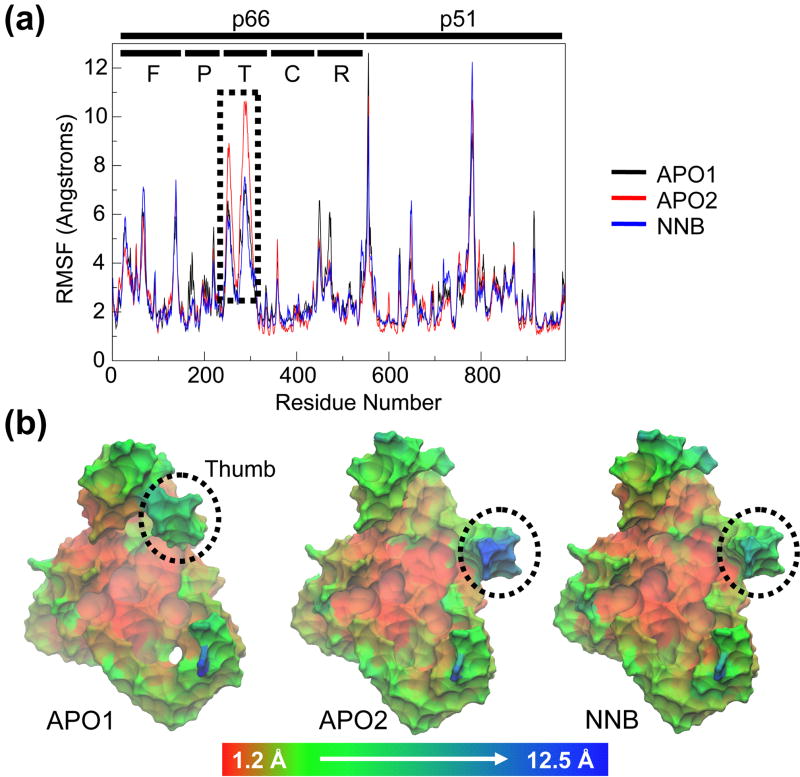
Figure 4.
Conformational flexibility. (a) RMSF of all Cα atoms from their time-averaged positions. Each subunit is indicated by black lines, along with the subdomains of the p66 subunit (F=fingers, P=palm, T=thumb, C=connection, R=RNH). (b) Starting structures of each system, colored by RMSF on a red-green-blue color scale (scale is non-linear to clarify less mobile regions). Protein is shown in molecular surface representation (Cα atoms only). Thumb subdomain is highlighted.

