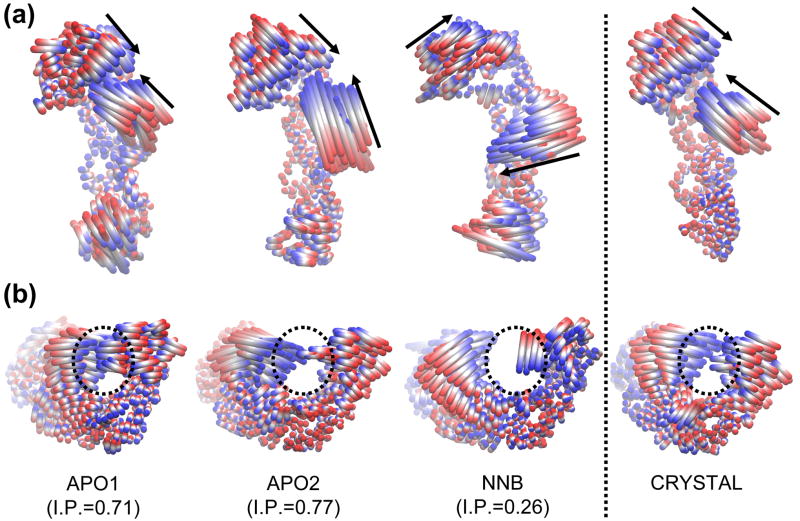
Figure 6.
Comparison of the motion described by eigenvector 1 from the MD and crystallographic ensembles. Motions are illustrated as linear interpolations between the extreme projections of the structures onto the eigenvectors. (a) and (b) Two alternative views of the motion, from above and behind the nucleic acid binding cleft, respectively. Arrows indicate the approximate direction of the fingers and thumb subdomains. Dotted circles highlight the nucleic acid binding cleft. The inner product (I.P.) between the eigenvector from each MD system and the crystallographic ensemble is indicated.

