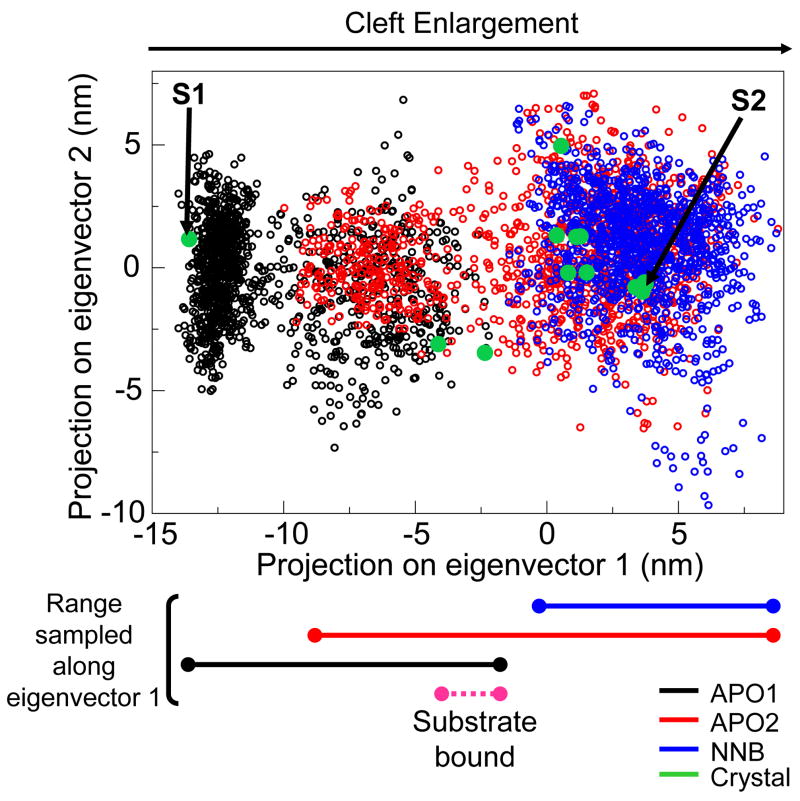
Figure 7.
Comparative sampling of essential motions. 2D projection of MD structures onto the plane defined by the top two eigenvectors from PCA of the crystallographic ensemble (as also shown in Figure 2). Unfilled circles represent the projections of structures taken from each MD system. Filled green circles represent projections of the crystal structures. “S1” and “S2” indicate the starting crystal structures used for the APO1 and APO2/NNB systems, respectively. The approximate range of eigenvector 1 sampled by each MD system is indicated below, along with the range sampled by the two substrate bound crystal structures.

