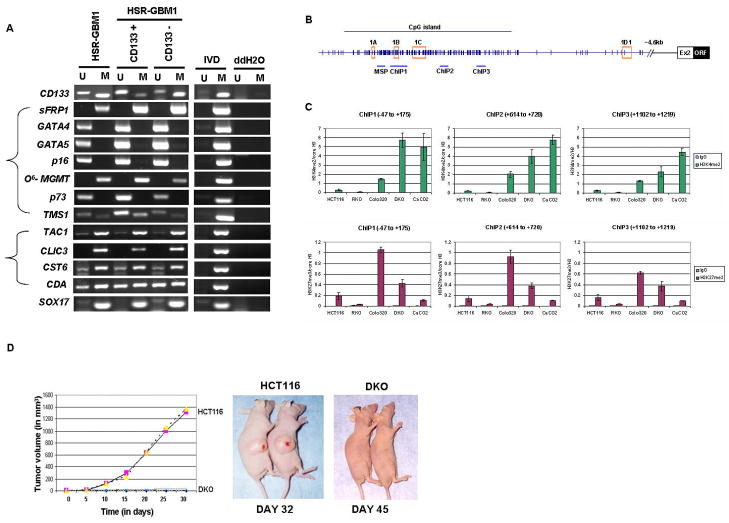
Figure 5.
(A) MSP analysis of CD133 gene and other genes in unsorted neurosphere cells (HSR-GBM1) and CD133 positive/negative cells from neurosphere cells (HSR-GBM1). ‘M’ and ‘U’ bands indicate methylated and unmethylated signals, respectively. IVD = in vitro methylated DNA, ddH2O=water control adding no DNA. (B–C) Relationships between DNA methylation states of CD133 and histone modifications in colorectal cancer cells. (B). Chromatin IP with rabbit IgG(control), anti-histone H3, anti-dimethyl H3K4 (active mark), and anti-trimethyl H3K27 (repressive mark) was performed on wild type HCT116, RKO, Colo320, DKO and Caco-2 cells. Immunoprecipitated DNA was amplified by realtime-PCR using primers designed for 3 different regions around 1B transcription start site within the CpG island in the CD133 promoter (−47 to +175, +614 to +720, +1102 to +1219). (C) Upper panel, real-time PCR analysis of dimethyl H3K4 enrichment over histone H3 at each region is shown sequentially from left to right with the most upstream region on the left. Lower panel, real-time PCR analysis of trimethyl H3K27 enrichment over histone H3 at each region. The values were averaged from at least 2 independent ChIP experiments and multiple real-time PCRs. Standard error bars are shown. (D) Loss of tumorigenicity for CD133 expressing CRC cells. Wild type HCT116 and isogenic DKO cells lacking DNMT1 and DNMT3b and highly enriched in CD133 positive cells were tested in vivo, in SCID mice, for tumor growth. Right panel, Duplicate experiments with 6 animals in each group were performed and tumor volume plotted against time for HCT116 (pink square and yellow triangle) or DKO (blue X or purple open circle). Typical tumor growth in animals is shown in Left panel.

