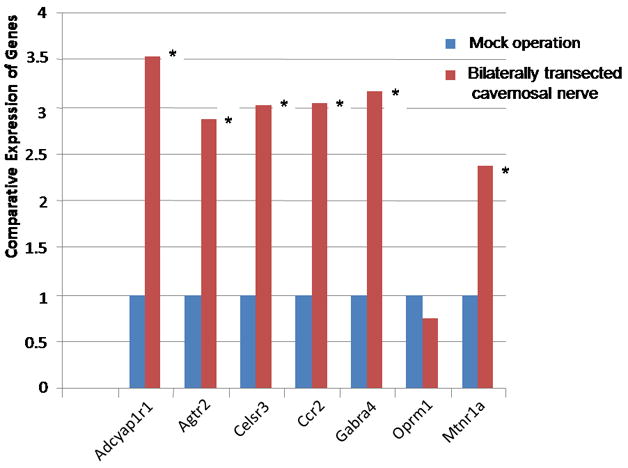
Fig. 4.

The expression of GPCR in corporal tissue following bilaterally ligation of the cavernous nerve for 9 days compared to mock operated animals. Expression of the various genes were determined by quantitative PCR, normalized to GAPDH, and the untreated cells used as the calibrator, essentially as described in 2. The results are an average of six animals, each reading performed in duplicate. In all GPCR genes investigated (except Oprm1) the gene is significantly up-regulated compared to mock treated animals (significance is determined by the students t-test, * =P <0.05). An exception is Celsr3 where the gene is significantly up-regulated (P <0.05). (Gene abbreviations are the same as in Fig 1).
