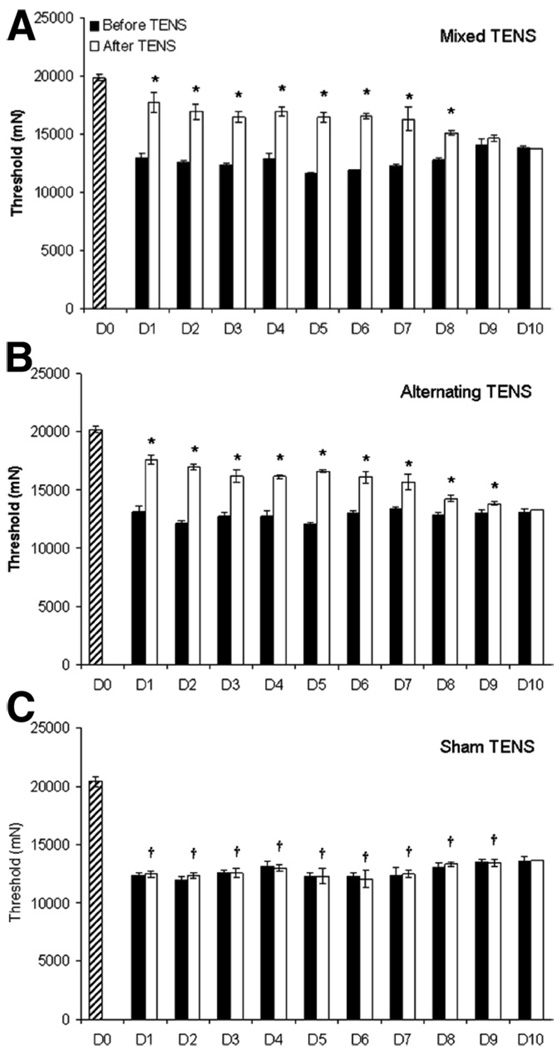
Fig. 3.
Bar graphs representing mechanical thresholds of the ipsilateral knee joint from animals that received (A) mixed-frequency TENS, (B) alternating-frequency TENS, or (C) sham TENS for the time before (black bars) and after (white bars) application of TENS. Striped bar represents time before knee joint inflammation. Plot represents mean values, error bars represent the SEM. *Significantly different from before application of TENS; †significantly different from before inflammation (P<.05).

