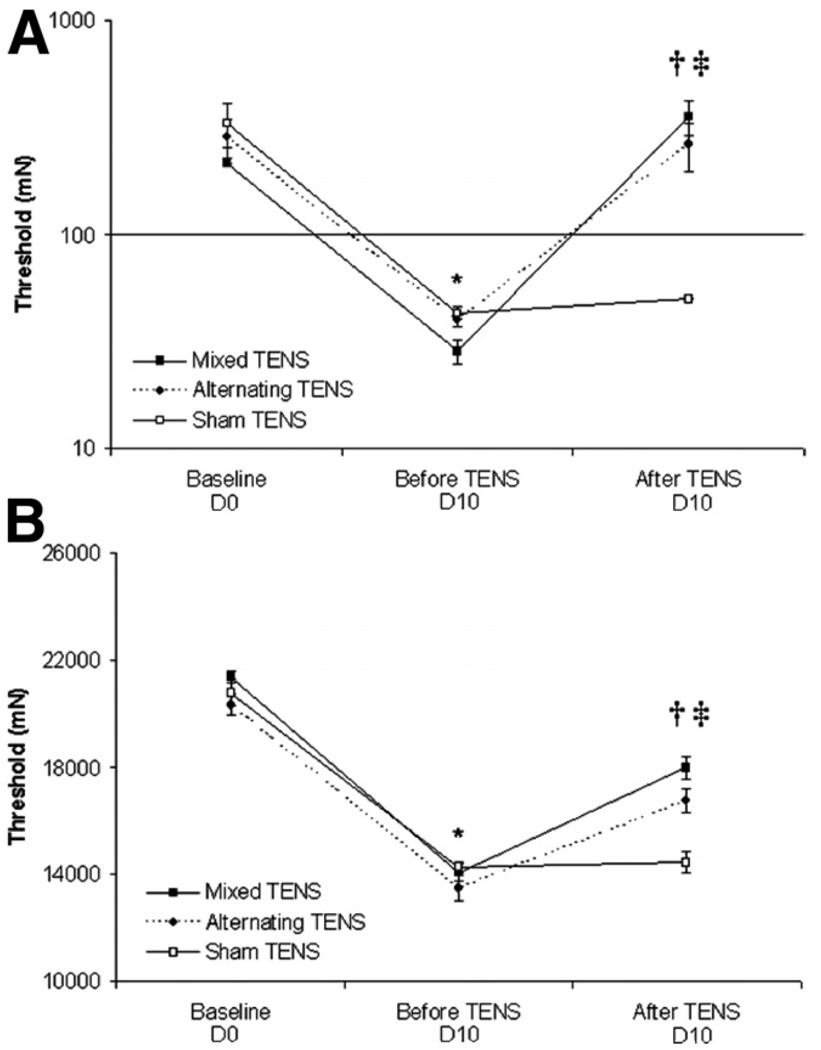
Fig. 4.
Line graphs representing mechanical thresholds of the (A) ipsilateral paw and (B) knee joint from animals that received mixed- and alternating-frequency TENS, and sham TENS. Baseline corresponds to time before the induction of knee inflammation. Error bars represent the SEM. *Significantly different from baseline; †mixed- and alternating-frequency TENS significantly different from before TENS treatment; ‡mixed-and alternating-frequency TENS significantly different from sham TENS (P<.05).

