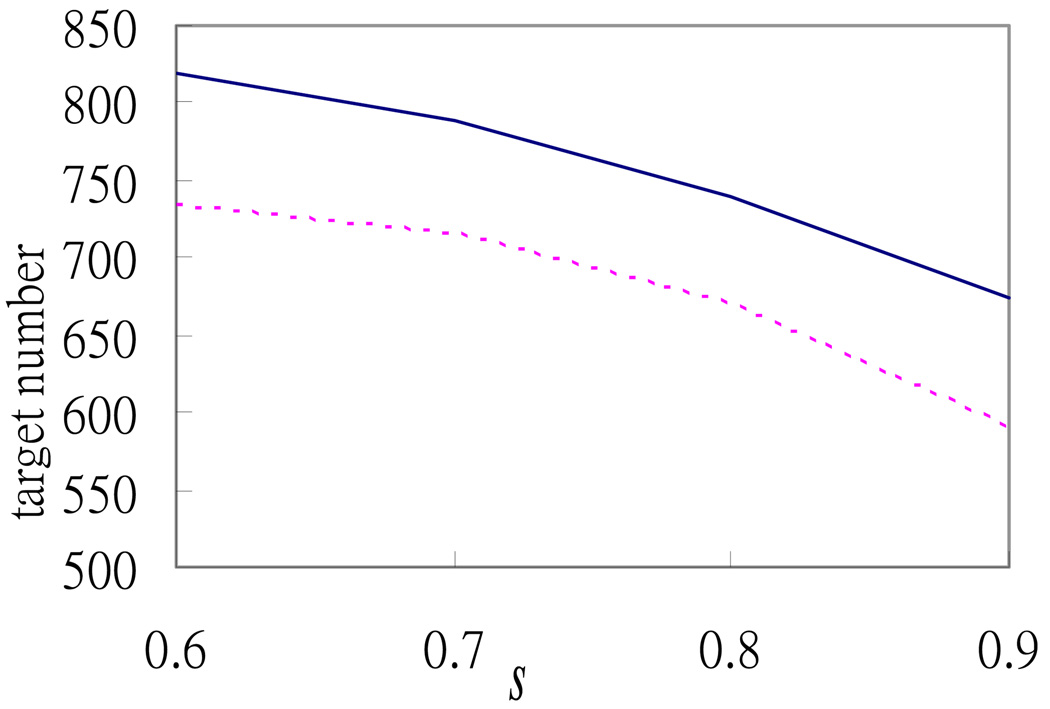
Fig 2.
Relationship between the number of selected high-confidence targets and the relative R2 value threshold used. The solid and dotted lines denote the numbers of high-confidence targets selected by the relative R2 method for the 1770 potential targets and the dataset constructed by random permutation, respectively, as s increases from 0.6 to 0.9, where s is the threshold of the relative R2 value as defined in the text.

