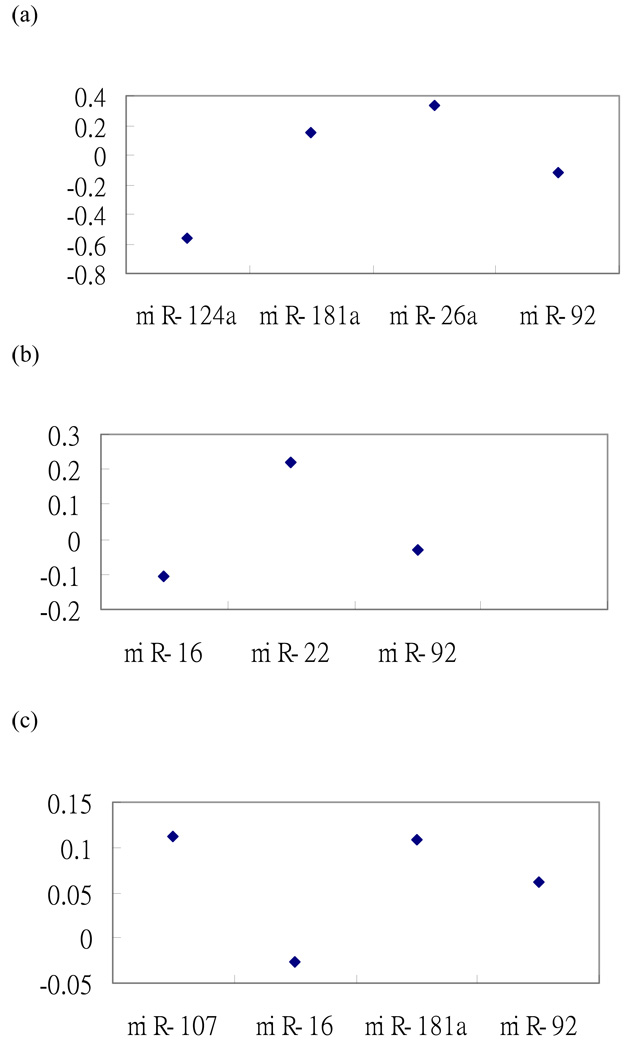
Fig. 4.
(a) The correlation coefficients between the homeodomain interacting protein kinase 1 ( HIPK1) mRNA expression level and the expression level of each of miR-124a, miR-181a, miR-26a and miR-92; (b) The correlation coefficients between the MAP2K4 mRNA expression level and the expression level of each of miR-16, miR-22, and miR-92; (c) The correlation coefficients of the BCL2 mRNA expression level and the expression level of each of miR-107, miR-16, miR-181a and miR-92.

